Biology Reference
In-Depth Information
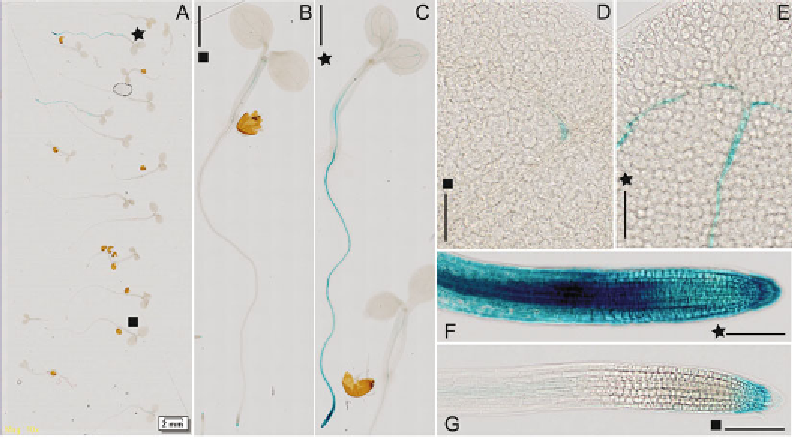
Fig. 2
Example of automated microscopy imaging using the .slide automated microscopy system (for the original
fi le in the native “.vsi” format,
see
http://www.ceitec.eu/functional-genomics-and-proteomics-of-plants/
rg46#vybaveni
). Shown is an illustrative result of the scanned slide with sample specimen from the
ProCKI1:
GUS
M2 family after EMS mutagenesis. Imaging of the whole slide of seedlings 7 days old was performed using a
10× objective. All of the presented fi gures represent visualizations from a single virtual slide obtained via
changes in the virtual slide magnifi cation. (
a
) Whole slide. In 2 out of 18 seedlings (designated by
star
), the
abnormal GUS pattern was identifi ed in comparison to the WT seedlings (designated by
square
). This implies
potential occurrence of a single-point mutation in the gene-regulating expression of
CKI1.
Scale bar 2 mm. (
b
,
c
) Closer view of the WT seedling (
b
) and the mutant (
c
). Scale bars 1 mm. Detail of cotyledons (
d
,
e
) and root
tip (
f
,
g
) imaging of the selected WT and mutant seedlings. Scale bars 100
μ
m
image in the native “.vsi” format, download the software
OlyVIA (olyVIA_v2.4.exe fi le) that is freely available at
http://
3. For viewing details on the low-magnifi cation background, the
electronic lens tool can be used.
4. A particular area of interest can be cropped and saved in vari-
ous commonly used image format types (e.g., “.bmp”, “.jpg”,
“.tiff”) for visualization in other applications (Fig.
2
).
4
Notes
1. Harvesting seeds from each M2 family separately facilitates the
identifi cation of individual mutation events in each family and
enables evaluating their segregation ratio.
2. We used an 8/16 h (light/dark) photoperiod, with light
intensity 150
mol/m
2
s, 50 % humidity, and temperature
21 °C/19 °C (light/dark).
μ
Search WWH ::

Custom Search