Biology Reference
In-Depth Information
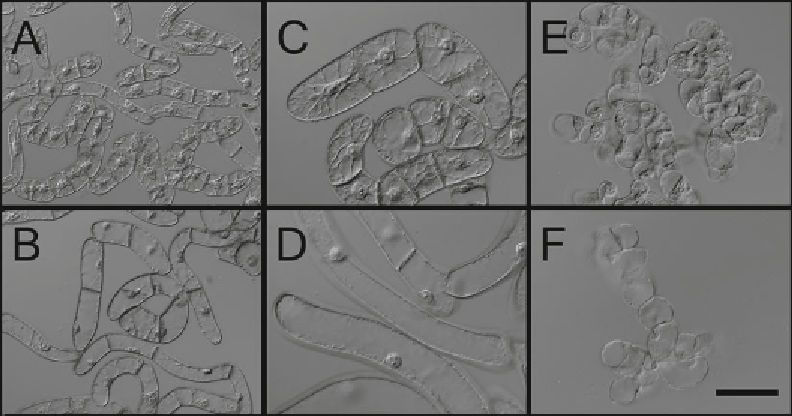
Fig. 3
Phenotype of suspension-cultured cell lines. (
a
,
b
) BY-2. (
c
,
d
) VBI-0. (
e
,
f
) LE. (
a
,
c
,
e
) Exponential phase
of the subculture interval. (
b
,
d
,
f
) Stationary phase of the subculture interval. Scale 100
μ
m
19. Determination of the actual mitotic index is a valuable charac-
teristic, but it cannot substitute determination of cell density
dynamics of the culture. One-shot value of the mitotic index
illustrates only the actual incidence of cells in the M-phase of
the cell cycle that can be affected by various factors, including
replication or mitotic blocks.
20. For optimal magnifi cation, use objective 40×.
21. Numerous phenotypic parameters can be determined in high-
quality plant cell lines to document their response to the
effects of various morphoregulatory factors. Besides the shape
and size of individual cells, morphology of cell fi les can serve
as a very sensitive indicator, particularly in case of VBI-0 or
BY-2. In both these lines, dynamics of formation and disinte-
gration of the multicellular cell fi les (fi laments) during subcul-
ture interval refl ects the normality or abnormality of the cell
division process (
see
Fig.
3
for normal appearance of cells at
distinct culture stages
). Consequently, even without any direct
counting of cell density, one can observe modifi cations of the
standard cell division rate from relative incidence of free cells
and cell fi les composed of 2-4-8 or more cells. Disturbance of
cell division polarity in tobacco cell lines is manifested by for-
mation of aberrant cell aggregates, randomly duplicated cell
fi les or irregular, respectively, spherical cell clumps.
22. During subculture intervals, cells of both VBI-0 and BY-2
lines exhibit almost entirely polar cell division and growth
(elongation). The diameter of the cells remains almost
Search WWH ::

Custom Search