Database Reference
In-Depth Information
Clearly, this isn't very user-friendly, and while you could try to tweak property
values to get the groups and group names you want, frankly, it is much easier to
create new columns in the views we're building our dimensions from to get exactly
the kind of grouping that you want. Nothing is going to be more flexible than SQL
for this job, and writing the necessary SQL code is not hard—usually a simple
CASE
statement will be sufficient. An expression such as the following in TSQL, when used
to create a new column in a view or a named calculation:
CASE WHEN Weight IS NULL OR Weight<0 THEN 'N/A'
WHEN Weight<10 THEN '0-10Kg'
WHEN Weight<20 THEN '10-20Kg'
ELSE '20Kg or more'
END
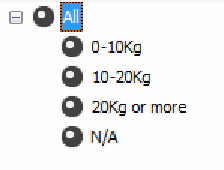
This yields much better results in the dimension when you build an attribute from it,
as shown in the following screenshot:
In this case, the names happen to sort in the order you'd want to see them, and you
might need an additional column to use as the key for the new attribute. The point
is that in this situation, as in many others, a little extra time spent modeling the
relational data to get it the way you want it pays dividends even when Analysis
Services seems to offer you a quicker way of getting things done.
Banding
Similarly, we might need to create an entire dimension that acts as a way of
grouping measure values on a fact table. For example, we might have a measure
that gives us the total value of an order, and we might want to find the total
number of orders whose values fall into some predefined bandings such as
High
Value
,
Medium Value
, or
Low Value
. In this case, again we would need to create
a dimension table to hold these bandings, but one problem we might have to face
is that the ranges used for the bandings might change frequently as the users'
requirements change—one day a
High Value
order might be one for more than
€10,000, the next it might be more than €15,000.


Search WWH ::

Custom Search