Database Reference
In-Depth Information
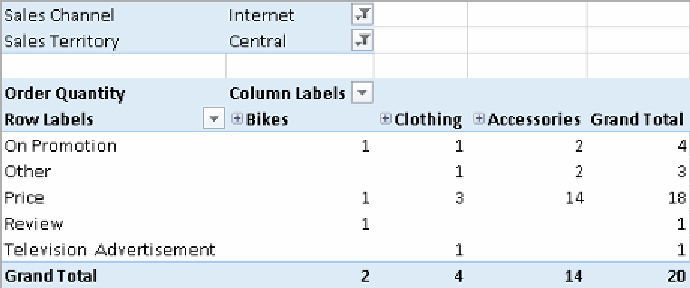
Now, we can process the cube and navigate it. In the following screenshot, we can
see a pivot table showing the
Order Quantity
measure filtered by sales made in
Central U.S. through
Internet Sales Channel
. We are filtering by sales made over the
Internet because
Sales Reasons
are gathered only for this kind of sale. The filter for
Central U.S. is only to get a small enough subset of data to make the calculation easy
to explain.
The total number of bikes sold is two. However, we have three different reasons
shown in this column. It means that at least one bike sale has more than one related
reason. The same is true for the other product categories. We can see that the total in
each column does not correspond to the sum of the preceding rows. However, the total
for each row corresponds to the sum of the preceding columns. This is because the
Sales Reason
dimension that is displayed on rows has a many-to-many relationship
with the measure we are analyzing, while
Product
Categories
, which( ) is displayed
on columns has a regular relationship and can be aggregated in the traditional way.
The aggregation of measures on a many-to-many relationship is a sort of "distinct
sum". In other words, when summing values, each item has to be summed only
once. If a bike has been sold because it was
On Promotion
, we don't have to sum its
value twice if it has been sold also because of its
Price
. This kind of behavior requires
that calculations on measures over a dimension having a many-to-many dimension
relationship need to be done at query time and cannot be calculated in advance and
stored in the fact table. However, these calculations can still leverage the cache of
Analysis Services.

Search WWH ::

Custom Search