Agriculture Reference
In-Depth Information
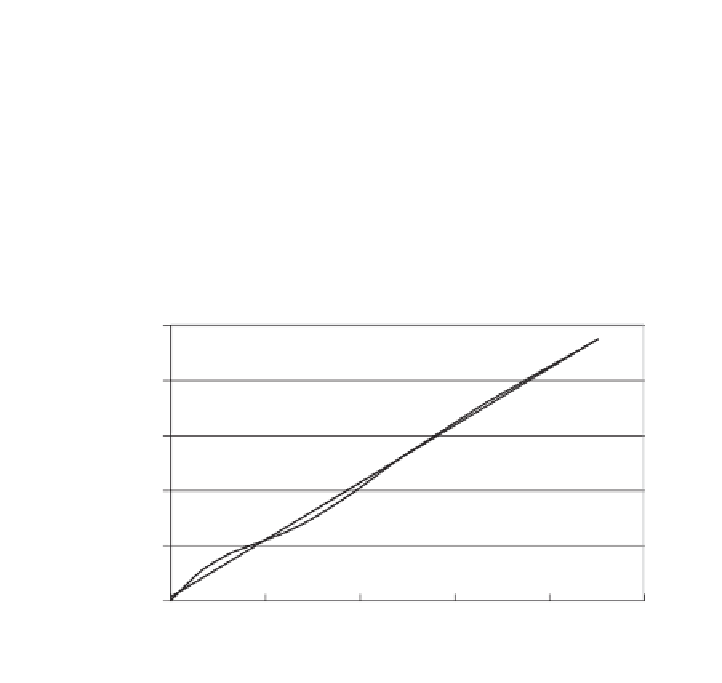
Data
Optical
Concentration
Density
0
0
10
0.15
30
0.3
60
0.65
90
0.95
y = 0.010x + 0.014
1
R
2
= 0.9966
0.8
0.6
0.4
0.2
0
0
20
40
60
80
100
Concentration
Figure 8.10.
Calibration curve including 0,0 as a point.
it is less than 1, this means that some of the error in measurement has not
been accounted for. In Figure 8.9 the
r
2
is 0.9957 and can be interpreted as
accounting for all the error except for 0.0043. This can also be expressed as a
percentage. Thus the
r
2
is 99.57%, and we have accounted for all except 0.43%
or the error.
2
Regression analysis, sometimes referred to as
least-squares analysis
, is a
standard statistical analysis, which is available in statistical packages as well as
Excel, and statistics text books [19]. In all analytical work using calibration
curves an
r
2
of 0.99 or higher is essential.
Once the calibration curve has been prepared and is of sufficient accuracy,
the extracted samples can be analyzed and the calibration curve used to relate
the results of the analysis of the unknown to the amount of component of
interest present in them [19].
2
Strictly speaking, we have used more significant figures than are warranted by the original data.