Agriculture Reference
In-Depth Information
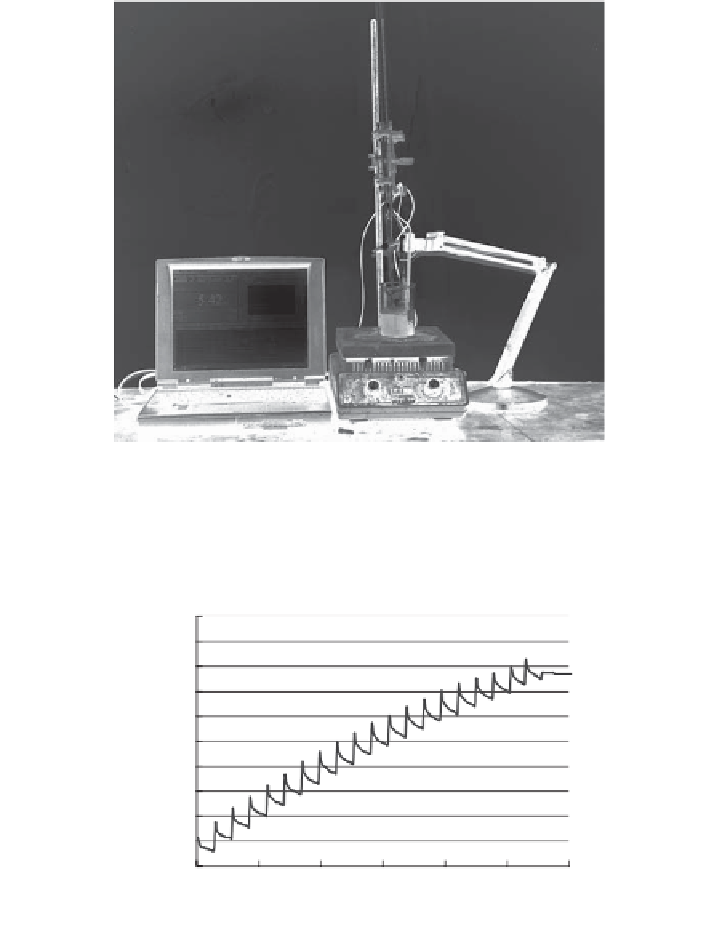
Figure 6.2.
Setup for titrating and recording pH change using a pH meter card in a laptop
computer.
Soil Titration With Calcium Hydroxide
7.5
7.3
7.1
6.9
6.7
6.5
6.3
6.1
5.9
5.7
5.5
0
50
100
150
200
250
300
mL of titrant
Figure 6.3.
Stepwise titration of acidic soil with calcium hydroxide.
The initial pH rise as shown in Figure 6.3 and fallback is interpreted to be
a result of two reactions. The initial rapid pH increase is a result of neutral-
ization of free acid in the soil solution. Often this is represented as H
+
;
however, in aqueous solutions it is better represented as H
3
O
+
, the hydronium
ion. The slower subsequent decrease in pH is a result of reequilibration