Travel Reference
In-Depth Information
85
80
75
70
Females
65
60
Males
55
50
45
1884
1909
1934
1959
1984
2009
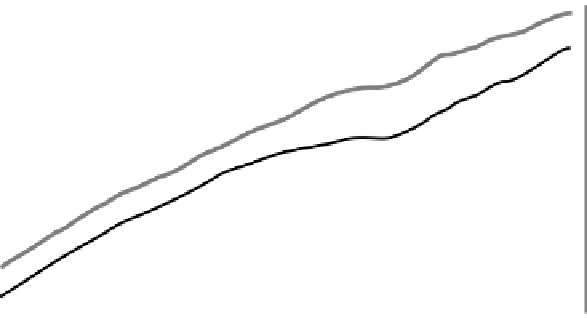
Figure 11.1
Life expectancy at birth in Australia.
Source
: Australian Bureau of Statistics
(2011a: 1)
highlights that the model has been presented in a large number of varia-
tions. The area of study can be traced back to 1903, when Rowntree (1903)
used the structure of FLC to examine poverty patterns in England (Murphy
& Staples, 1979). Since it originated, various researchers have altered it,
expanded it and changed it. More recent contributions in the field have
reflected societal trends (e.g. expanding the model to include single parents).
However, some of the earlier FLC model expansions partly reflected the
extended life expectancy, which created time for more stages to develop.
Extended life expectancy has allowed a shift in the median age for women
entering the FLC. This has been responsible for 'the continuing postpone-
ment of marriage' (Glick, 1977: 5).
Life expectancy has increased more than 30 years over the past 130 years
in Australia (see Figure 11.1). At the time the FLC was created, in 1903,
the average life expectancy in Australia was around 55 for males. By the
mid-1930s this had risen to around 65, and to around 67 in the 1960s. Thus,
an extended life allowed for more stages in life.
The influence of extended life span can be seen through the develop-
ment of the FLC model from the 1930s to the 1960s. The 1930s is the period
in which a number of researchers started to actually evaluate the FLC,
resulting in some amendments to it. In that decade, three different versions
of the FLC model evolved. The first of the three 1930s papers published