Biology Reference
In-Depth Information
2
7
9111
1
H
3
= 2.585
H
2
= 1.435
H
1
= 0.786
H
0
= 0
FIGURE 3.3
Diagram representing the SLC algorithm applied to the data of Example
3.12
. The column
on the right gives the corresponding Shannon's entropy increasing at each consecutive
level.
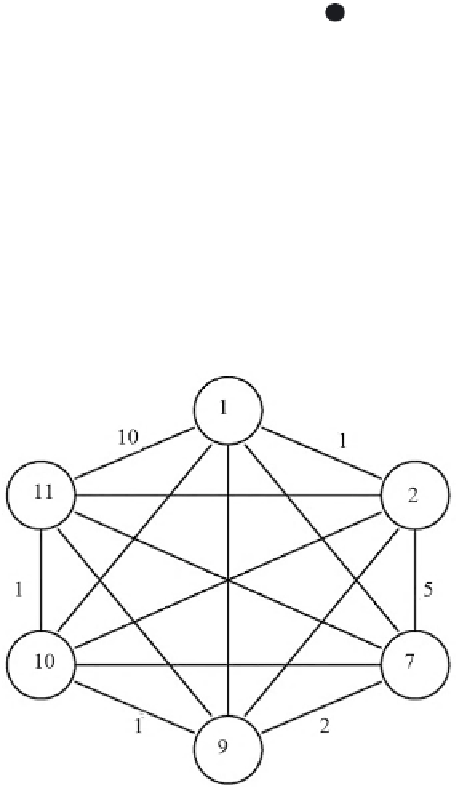
FIGURE 3.4
The complete weighted graph constructed from vector entries 1, 2, 7, 9, 10, 11. Only
the edge weights of the outer edges are given.
a similar manner to obtain a finer discretization. A component is further disconnected
if, and only if, both (1) and (2) below hold:
1.
The minimum vertex degree of the component is less than the number of its
vertices minus 1. The contrary implies that the component is a complete graph
by itself, i.e., the distance between its minimum and maximum vertices is smaller
than the distance between the component and any other component.


Search WWH ::

Custom Search