Biology Reference
In-Depth Information
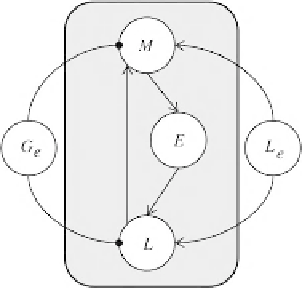
FIGURE 1.4
Wiring diagram for the minimal model.
E
denotes the
LacZ
polypeptide,
M
- the mRNA,
L
- internal lactose.
L
e
and
G
e
denote external lactose and glucose, respectively. The
nodes in the shaded rectangle represent the model variables while the outside nodes rep-
resent the model parameters. Directed links represent influences between the variables:
A positive influence is indicated by an arrow; a negative influence is depicted by a circle.
Self-regulating links (for nodes that may influence themselves) are not pictured.
dependency graph
) for the model that reflects the network topology; that is, it depicts
the dependencies between variables and parameters. A wiring diagram is a directed
graph in which each node represents a variable or a parameter for the model and the
directed links depict influential interactions: if
x
and
y
are two nodes of the graph, a
directed link from
x
to
y
indicates that the quantity
x
affects the quantity
y
. Somewiring
diagrams contain additional information about the types of interactions between the
model components: a positive influence is usually indicated by an arrow, while a
negative influence may be depicted by a square (as in Figure
1.3
)orbyacircle(see
Figure
1.4
). In many ways, the diagram in Figure
1.3
is similar to a wiring diagram
except that it also includes a cartoon of the structural arrangement of the
lac
genes
with the promoter and operator regions, and some of the system's elements appear
more than once (e.g., the LacZ protein).
It is always best to begin with a simple starter model with a small number of
variables and parameters, from which to expand, if necessary. The models of the
lac
operon we will discuss initially follow a “minimal model” approach for choosing
variables and parameters after Santillan et al. [
14
]. The model does not consider the
CAP-cAMP positive control mechanism, which is essentially an amplifier for the
transcription process. We focus on the following remaining elements (the notations
in the parentheses are the mathematical names we will use from now on to denote
their concentrations): mRNA (
M
),
β
-galactosidase (
B
),
lac
permease (
P
), intracellular
lactose
.Dueto
the fact that external conditions for the cell change slowly compared to the lifespan
of
E. coli
, the concentrations
L
e
and
G
e
remain relatively unchanged with time. We
will assume that they are constants and include them in the set of model parameters.
(
L
)
, allolactose
(
A
)
, external lactose
(
L
e
)
, and external glucose
(
G
e
)


Search WWH ::

Custom Search