Biology Reference
In-Depth Information
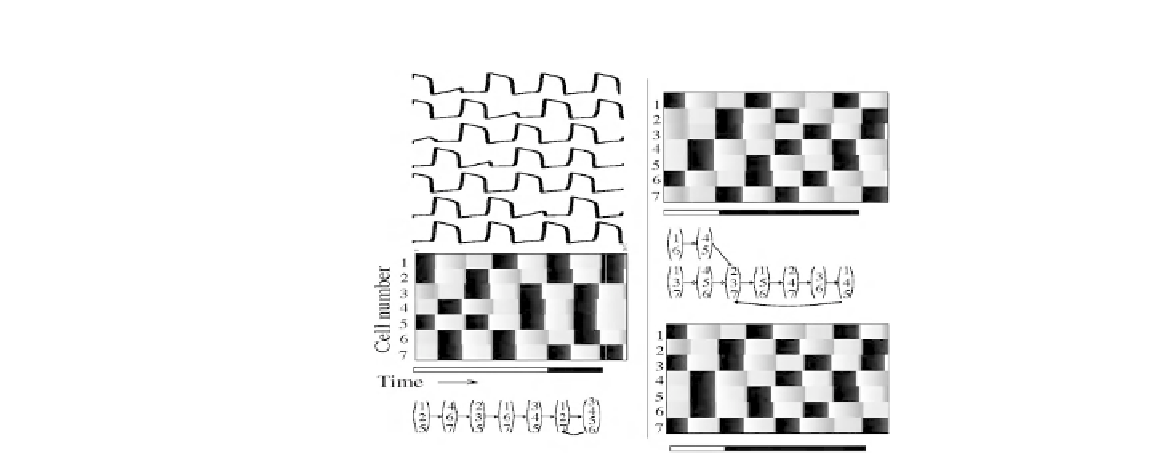
FIGURE 6.6
Simulations of an ODE model
M
that realizes the network
N
D
,1,1
, where
D
is the
digraph of Figure
6.2
b. The upper left panel shows the time courses of the membrane
potentials of the seven cells in the network. The grey scale representations illustrate
the emergence of discrete episodes with rather sharp boundaries. The corresponding
trajectories in the discrete model
N
are represented by the active cells in each episode.
Adapted from [
17
].
=
the number and size of attractors and length of transients, depend on
both
the intrin-
sic properties of the individual neurons, such as their refractory periods or firing
thresholds, and the network architecture. A misguided assumption in much of the
neuroscience literature is that if one understands how neurons are connected to each
other in a given neuronal system, then one can determine the network's population
dynamics. Here we have shown that this is typically not the case; the intrinsic prop-
erties of cells in the network may be equally important. Because of Theorem
1
,this
result translates immediately to biologically based ODE models for neuronal activity.
6.8
DIRECTIONS OF FURTHER RESEARCH
Much of the theory described in this chapter has been motivated by experimentally
observed firing patterns in an insect's antennal lobe. However, most of the dynamic
behaviors described in this chapter, such as synchrony and dynamic clustering, arise
in many other neuronal systems. For example, these types of firing patterns have
been observed in a brain region known as the basal ganglia in humans suffering
from Parkinson's disease. See, for example [
19
,
20
]. In this case, too much synchrony
among neurons within the basal ganglia represents a pathological state. In healthy
patients, there is very little correlation or synchrony among neurons within the basal

Search WWH ::

Custom Search