Environmental Engineering Reference
In-Depth Information
Level 1
Level 2
Level 3
250
250
250
200
200
200
150
150
150
100
100
100
50
50
50
0
0
0
a
b
c
0
50
100
150
200
250
0
50
100
150
200
250
0
50
100
150
200
250
X
Level 4
Level 5
Level 6
250
250
250
200
200
200
150
150
150
100
100
100
50
50
50
0
0
0
d
e
f
0
50
100
150
200
250
0
50
100
150
200
250
0
50
100
150
200
250
Level 7
250
200
150
100
50
0
g
0
50
100
150
200
250
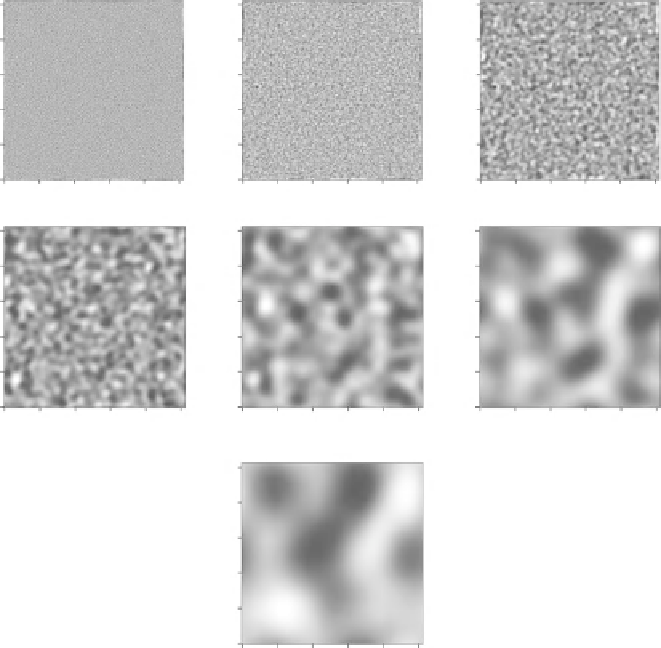
Fig. 7.5 Back-transformed images from the decomposition of the data in
Fig. 7.4a
. Each panel
shows the spatial structure at an individual isolated scale
a wide variety of shapes and forms [
90
]. The majority of wavelet applications have
been in the analysis of temporal signals to identify periodicity in things such as
climatic variability [
91
] and epidemiological time series [
92
,
93
]. However, spatial
applications of wavelet analysis in ecology continue to be developed and have
been used to investigate one-dimensional forest canopy gap structure [
87
], vegeta-
tion reflectance [
89
], two-dimensional structure in grassland productivity [
81
],
tree crown identification [
94
], and the significance of spatial structure in forest
basal area [
74
].
When data are not sampled in a continuous way (i.e., they are irregularly spaced),
multi-scale decompositions can be performed using spatial eigenfunction analyses
such as principal coordinate analysis of neighbor matrices (PCNM) and Moran's
eigenvector maps (MEM) [
48
,
95
,
96
]. These methods model spatial structure in
a multivariate framework using distance matrices where the spatial coordinates of the
sampled sites are converted into a set of synthetic spatial variables that represent