Environmental Engineering Reference
In-Depth Information
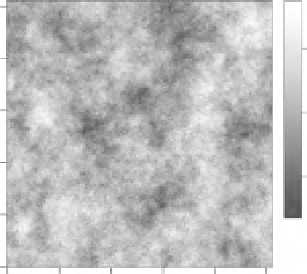
Simulated Data
Wavelet Variance Scalogram
250
0.30
0.5
0.25
200
0.20
150
0.0
0.15
100
0.10
−0.5
50
0.05
0.00
a
b
0
0
50
100
150
200
250
1
2
3
4
5
6
7
X
Scale (Power of 2)
Fig. 7.4 Example of a hierarchical multi-scale decomposition of two-dimensional, quantitative
data using wavelets. (a) Simulated spatial data. (Data were simulated using an exponential
variogram model with the following parameters: Sill = 1; Range = 40; Nugget = 0.1).
(b) Scalogram that summarizes the proportion of total variance in the original data
associated with each scale of the decomposition. Wavelet decomposition was accomplished
using a maximal-overlap discrete wavelet transform (MODWT; Percival and Walden [
109
])
of spatial autocorrelation such as Moran's
I
and Geary's
c
[
7
]. Multi-scale methods
of analysis identify both global and local scales of structure, can assign relative
importance to difference scales, and do not assume stationarity. Instead, such
methods can be used to identify boundaries and scale-specific stationary subregions
within a larger spatial context [
7
,
74
]. Multi-scale methods of analysis include
lacunarity analysis [
83
], wavelets [
74
,
81
,
84
], distance-based Eigenvector methods
(e.g., PCNM; [
85
]), and local spatial statistics [
86
].
Wavelet analysis is a particularly powerful method of local spatial analysis that
can be used to decompose continuous data into its scale-specific components
[
87
,
88
]. A proportion of the total variance in the data set is associated with each
level of the decomposition through use of the wavelet variance [
84
] and the relative
contributions of different scales to overall structure can be assessed and visualized
as a scalogram (
Fig. 7.4b
). Each of these scales of pattern can then be isolated using
a multi-resolution decomposition (
Fig. 7.5
;[
88
]). Under conditions where observed
spatial pattern is assumed to be the result of multiple interacting processes, such
data decomposition provides an opportunity to assess the relationship among
processes and individual scales of spatial structure present in the data. In combi-
nation with the scalogram (
Fig. 7.4b
), the relative importance of these different
scales can also be determined and further analyses can be restricted to only those
spatial layers that correspond to the scales of interest. Isolated scales of spatial
pattern can then be examined independently or used as scale-specific predictors in
further statistical analyses [
89
].
Whereas Fourier analysis assumes that observed patterns can be described as
a sum of sine waves of different frequencies, wavelet analysis identifies global and
local structure at different scales using a local wavelet template that can take on