Biology Reference
In-Depth Information
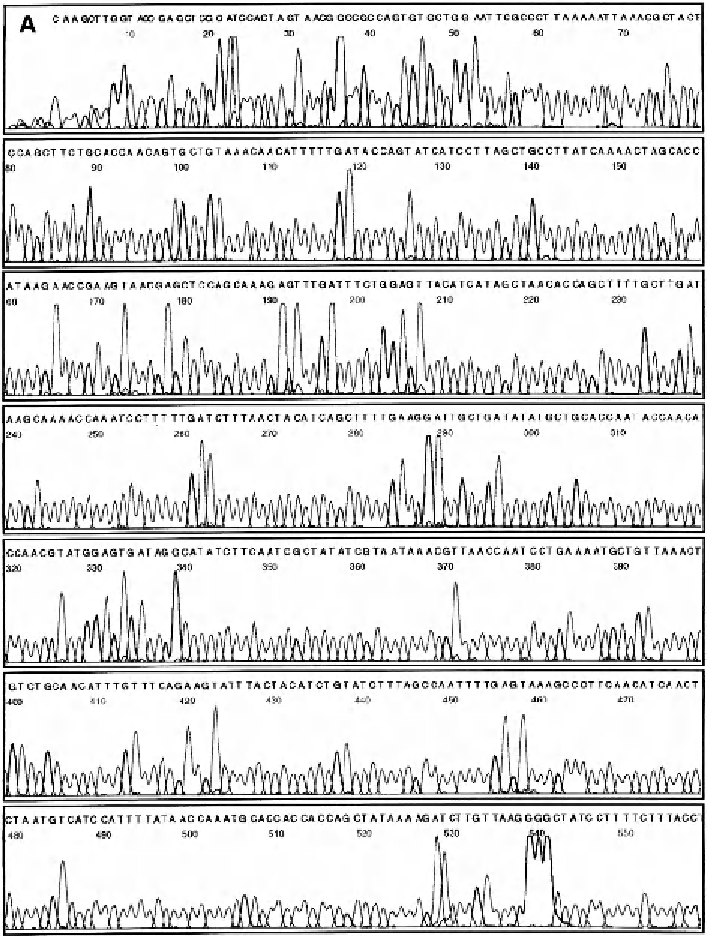
Figure 12.5
A) Sanger DNA sequence data are obtained from an automated sequencing facility in
this format. The different peaks representing A, T, C, and G are printed in different colors but are
shown in black and white here. This sequence is the noncoding sequence, thus the sequence to be
analyzed must be transformed into the complementary coding sequence.