Information Technology Reference
In-Depth Information
Table 5.
Comparison of descriptive statistics between the actual field data and the estimated
FLM results for both weekday and weekend
Weekday
Weekend
40 km/hr
60 km/hr
80 km/hr
40 km/hr
60 km/hr
80 km/hr
S*
E**
S*
E**
S*
E**
S*
E**
S*
E**
S*
E**
Mean
38.2
38.9
67.8
69.7
68.7
75.9
44.8
50.6
84.7
80.9
70.1
83.7
Median
36.6
38.9
66
70
73
74
45.1
51.2
87.1
80.4
71.5
84.2
Min
29.9
29.9
55
68.8
48
71.5
39.5
40.5
52.2
79.7
47
81.6
Max
50
45.9
82
70.7
93.9
81.1
51.5
56.5
107.8
84.2
93
84.2
S.D.
***
6.4
6.1
9.6
0.9
11.4
4.1
4.5
6.3
18.7
1.5
13.6
0.9
*S. Data= Survey Data; **E. Data= Estimated Data; ***S.D.= Standard Deviation.
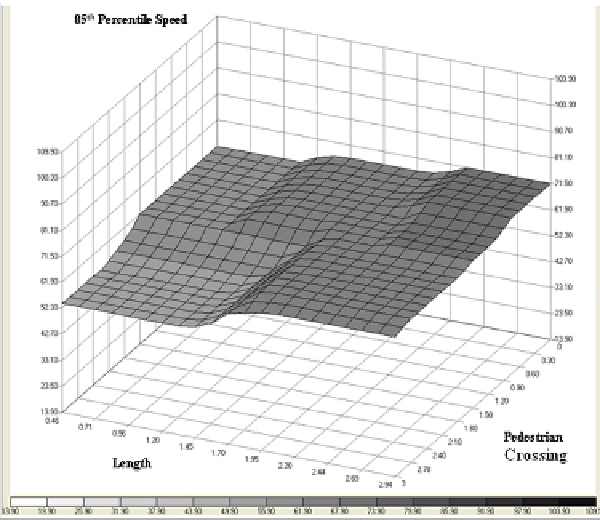
Figure 7 shows the effects of 'number of pedestrian crossings' and 'length' on the
85
th
percentile speed for weekday model. As indicated in the figure, the 'length' vari-
able is positively correlated with the 85
th
percentile speed. On the other hand, the
'number of pedestrian crossings' is negatively correlated with the 85
th
percentile
speed. The highest 85
th
percentile speed (71.50 km/hr) is found for highest 'length'
(2.9 km) and least 'number of pedestrian crossings' (0-1).
Fig. 7.
Effects of 'Length and Number of Pedestrian Crossings' on the '85
th
Percentile Speed'
(weekday model)