Information Technology Reference
In-Depth Information
y
data space
2
y
*
f(x
3
f(x )
4
y
y
1
latent space
x
x
*
x
3
4
Fig. 2.
UNN
g
: testing only the neighbored positions of the nearest point
y
∗
in data space
(a) unsorted
S
(b) UNN embedding of
S
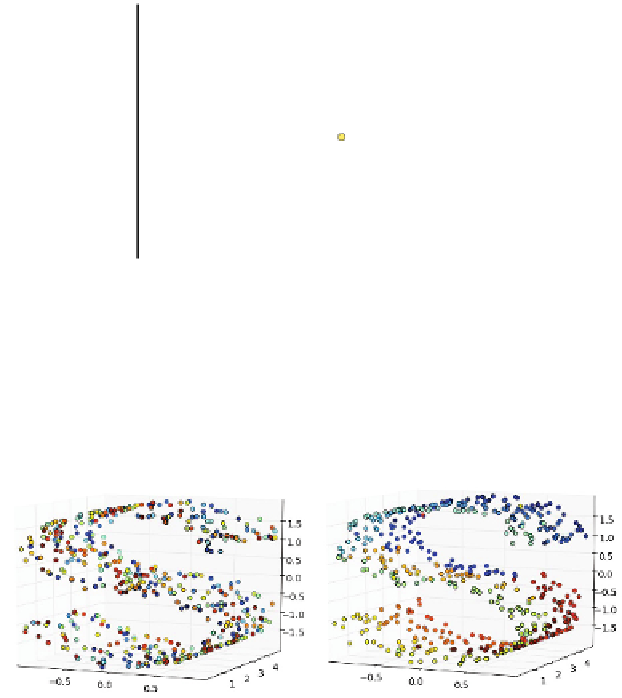
Fig. 3.
Results of UNN on 3D-S: (a) the unsorted
S
at the beginning, (b) the embedded
S
with
UNN and
K
=10
. Similar colors represent neighborhood relations in latent space.
3.4
Experiments
In the following, we present an experimental evaluation of UNN regression on artificial
test data (2-, and 3-dimensional
S
data set, USPS digits data set [13]), and real-world
data from astronomy.
S
and USPS.
The 3D-S variant without a hole (3D-S
h
) consists of 500 data points.
Figure 3 (a) shows the order of elements of the 3D-S data set at the beginning. The
corresponding embedding with UNN and
K
=10
is shown in Figure 3 (b). Similar
colors correspond to neighbored points in latent space. Figure 4 shows the embedding
of 100 data samples of 256-dimensional (16 x 16 pixels) images of handwritten digits
(2's). We embed a one-dimensional manifold, and show the high-dimensional data that
is assigned to every 14th latent point. We can observe that neighbored digits are similar