Database Reference
In-Depth Information
A KPI is a type of metric consisting of three to four measures that together
provide information on how well the business is progressing towards
a goal. These are very common in Business Intelligence dashboards or
summary reports.
The following is a list of the measures that make up a KPI metric:
•
Value
: This is the current value of the metric.
•
Target
: This is the goal value.
•
Status
: This is the value that provides context between the Value
and Target measures. This is typically defined as a breakdown of
ranges corresponding to bad (red), ok (yellow), and good (green).
•
Trend
: This is the current trajectory based on recent history
(optional).
•
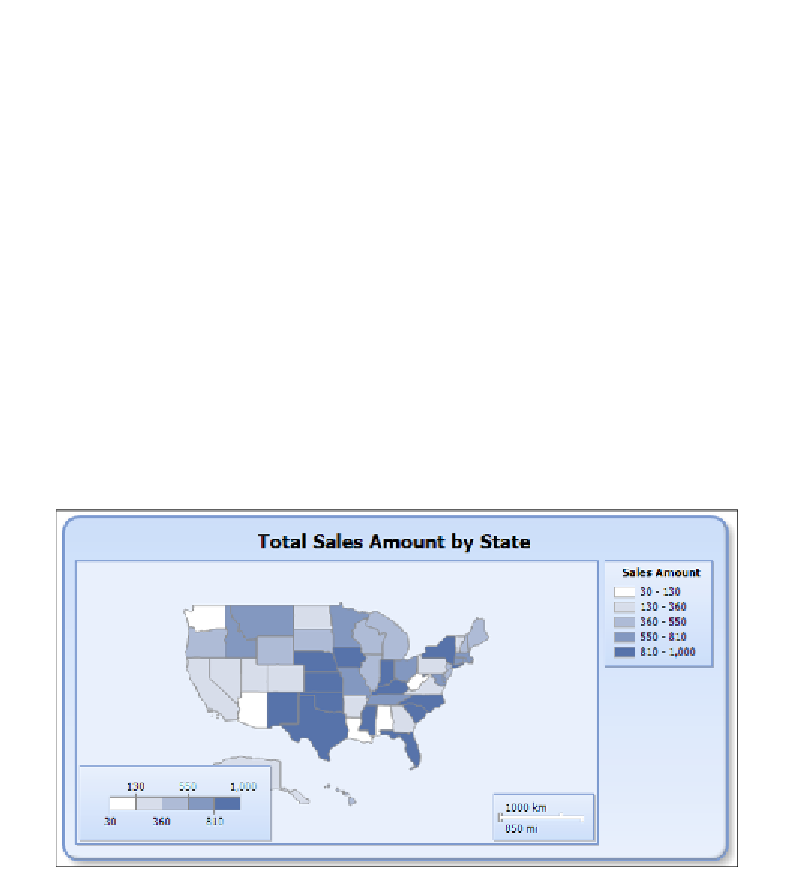
Map
: This report item provides the ability to visualize information in
a spatial or geographical context. There are typically two types of data
involved with the map report item: spatial and analytical. Spatial data is
required and provides the coordinates for layout. Analytical data is optional
and provides the business measures or metrics.
Example of map report item
•
Data bar
: This report item is typically used in conjunction with a table
or matrix report item and is good for visualizing the relative strength/
weakness of a metric or measure across a group of business entities
such as sales territories.