Database Reference
In-Depth Information
Adding a slicer
Now that we have a few visualizations placed on the screen, let's add a slicer object
to improve user experience by providing the ability to filter the data by
Calendar
Year
. Follow these steps:
1.
Click on a blank space on the canvas.
2.
In the
Field List
, expand the
Date
table and click on the checkbox next to
Calendar Year
.
3.
Move the table of year values to the bottom-right corner of the screen.
4.
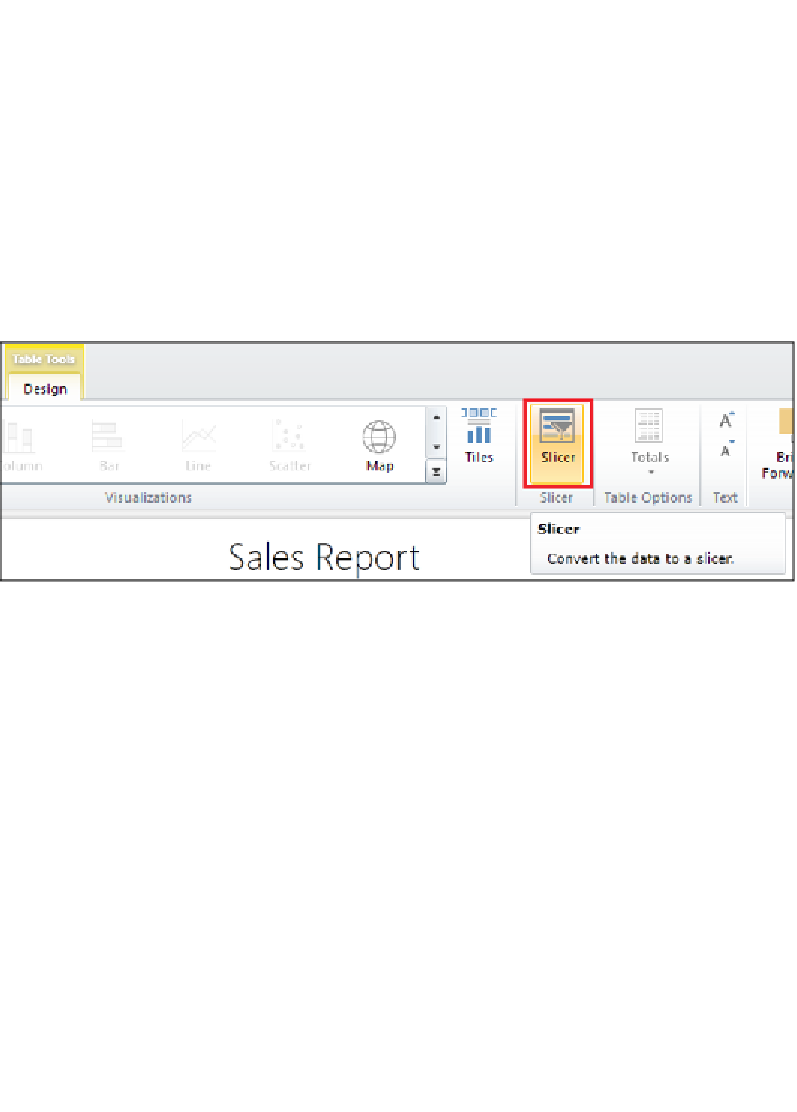
Up in the ribbon, click on the
Slicer
button to convert the table of year values
into a slicer object as shown in the following screenshot:
Slicer button in the ribbon
5.
Click on and hold the bottom-right corner of the slicer object and drag it out
towards the bottom-right corner of the screen to increase the size.
6.
Now again from the ribbon, click on the button shown in the following
screenshot to increase the size of the slicer values. Your report canvas
should now resemble the following screenshot: