Database Reference
In-Depth Information
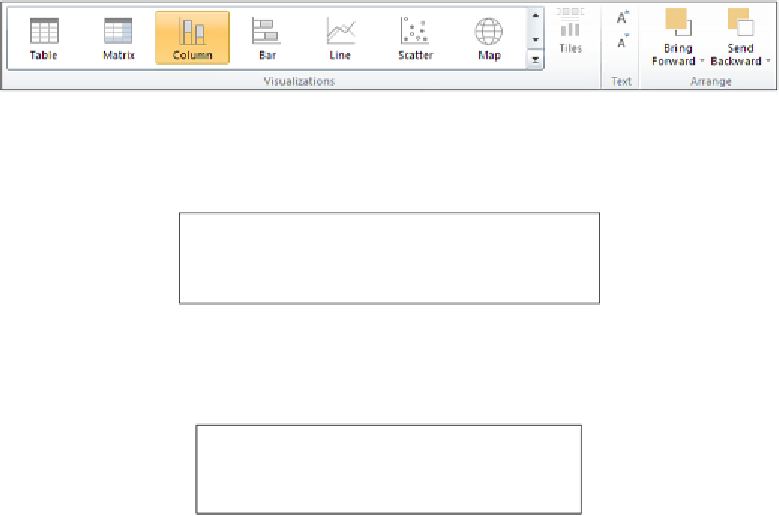
The Design ribbon is visible when a visualization is selected:
The Design ribbon in SharePoint
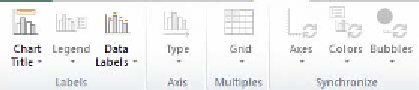
The Layout ribbon is visible when a chart is selected. It will have different buttons
depending whether you are on a chart, as shown in the following screenshot:
The Layout ribbon for charts in SharePoint
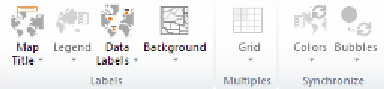
The Layout ribbon is visible when a map is selected, as shown in the
following screenshot:
The Layout ribbon for map in SharePoint
The parts of the interface are described as follows:
•
Ribbon
: This is located at the top. It contains all the commands that can be
performed either on the entire report or on the currently selected object in
the report. Common tasks are grouped together.
•
View Area
: This is available only in SharePoint. It is located on the left-hand
side. It tracks different states or views of the data in order to analyze the data
at various points in time or as values change.
•
Canvas
: The center section is what contains the different data visualizations
in the report. This is where you place the tables, charts, and filters that will
display selected data from the data sources.
•
Field List
: This is on the upper right of the screen and contains the tables and
fields from the data model. You will move these fields to build the report.