Agriculture Reference
In-Depth Information
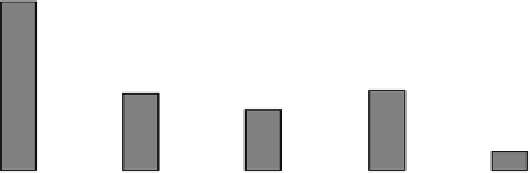
Figure 11.6
Share of Chna's agrcultural mports by commodty
grouping, 1992-2001 and 2002-2005 (per cent)
50
1992-2001
2002-2005
45
40
35
30
25
20
15
10
5
0
Cereals,
Vegetable
Olseeds and
Ols
Raw Materials
for Textles
Anmal Products
Processed
Agrcultural
Products
Horticultural
Products
Sources
: Author's calculaton. Data from 1992 to 2004 are from Unted Natons Statstcs
Division,
Commodity Trade Statistics Database
, COMTRADE. http://unstats.un.org/unsd/
comtrade/default.aspx. Data for 2005 are from Chna General Admnstraton of Customs
(various issues, 2005).
Zhongguo Haiguan Tongji Yuebao
[China Customs Statistical
Monthly Report], Zhongguo Haiguan Chubanshe, Beijing.
vegetable ols. Raw materals for textles and anmal products are also
mportant. All ncreased ther shares snce 2001 at the expense of processed
agrcultural products.
Changes in the pattern of China's agricultural trade, by factor
ntensty of producton
To see f there have been any changes n the pattern of agrcultural trade
in terms of factor intensity, agricultural trade was grouped into labour-
ntensve products and land-ntensve products. The labour-ntensve
products include processed agricultural products, animal products,
horticultural products and silk, while the land-intensive products include
cereals, vegetable oilseeds and vegetable oils, and raw materials (excluding
slk) for textles.