Agriculture Reference
In-Depth Information
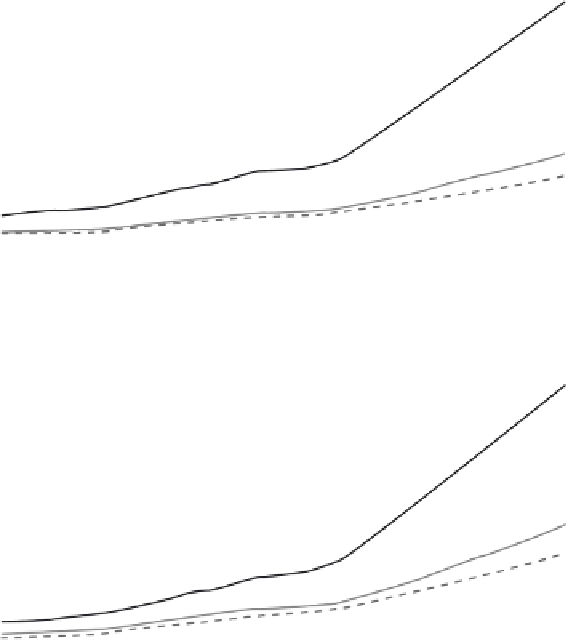
Figure 6.1 Per capita GDP by region, 1978-2000
5,000
Constant prices, simple averages
4,000
Eastern
Central
Western
3,000
2,000
1,000
0
1978
1980
1982
1984
1986
1988
1990
1992
1994
1996
1998
2000
4,000
Constant prices, population weighted averages
3,000
Eastern
Central
Western
2,000
1,000
0
1978
1980
1982
1984
1986
1988
1990
1992
1994
1996
1998
2000
Source:
Author's construction based on data from National Bureau of Statistics of China,
2001.
Statistical Yearbook of China
, China Statistics Press, Beijing.