Java Reference
In-Depth Information
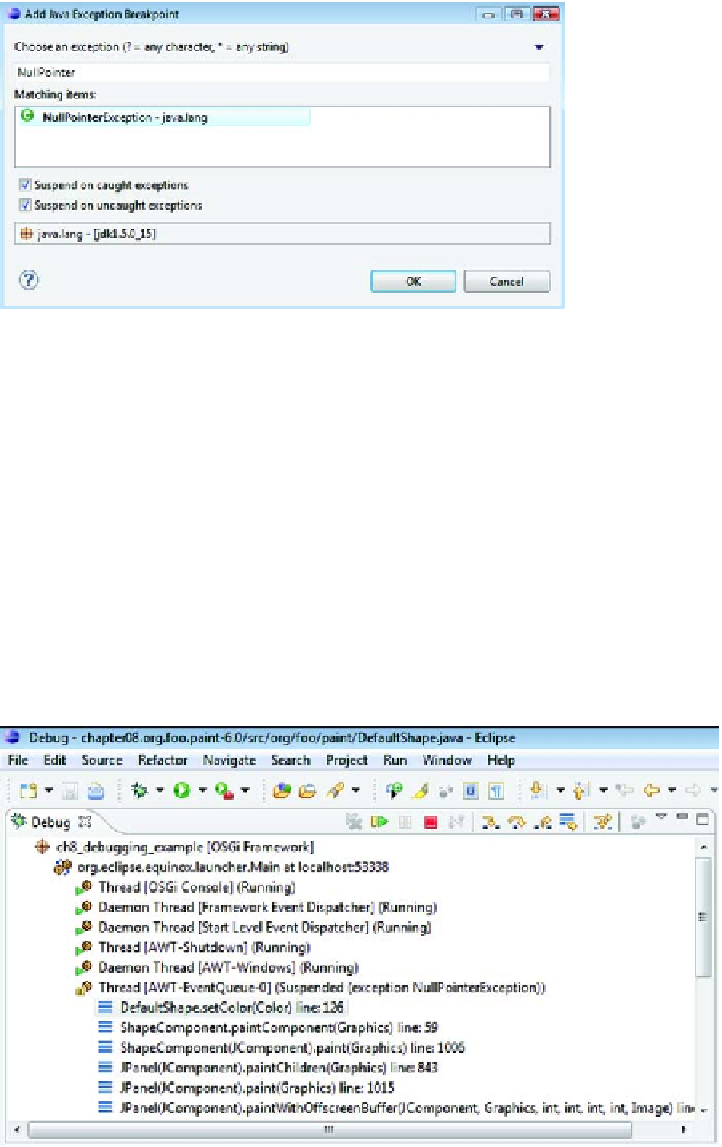
Figure 8.4
Watching
for
NullPointer-
Exception
s
Before you start to paint, let's add a breakpoint so the debugger will stop when some-
one tries to use a null object reference. Choose Run > Add Java Exception Breakpoint
to open the dialog box shown in figure 8.4. Select
java.lang.NullPointerException
and click OK.
You now have the two paint examples running in the Eclipse debugger. If you try to
paint with the original version, which has three shapes in its toolbar, everything works
as expected. But if you try to paint with the new version—the one with the paintbrush
in its toolbar—the debugger stops (see figure 8.5).
Look closely at the title bar. The debugger has correctly identified that the affected
source code is from chapter08 even though there are multiple versions of this class
loaded in the Java runtime. Again, the problem is caused by a null shape object. Using
the Eclipse
IDE
, you can trace the exception back to the specific bundle project. You can
also click different frames in the stack trace to see what other bundles (if any) were
Figure 8.5
Exception caused by a bad
setColor()
method