Java Reference
In-Depth Information
8.1.1
Debugging in action
The Java Debugger (also known as jdb) is a simple debugging tool that primarily exists
product in its own right. This means it lacks some of the polish and user-friendly fea-
tures found in most other debuggers. But jdb is still a useful tool, especially when
you're debugging on production servers that have limited installation environments.
DEBUGGING WITH JDB
You first need to build the broken example. When that's done, you can start jdb:
$
cd chapter08/debugging-bundles
$
ant dist
$
jdb -classpath launcher.jar launcher.Main bundles
Initializing jdb ...
>
Jdb starts up, but it won't launch your application until you type
run
:
>
run
run launcher.Main bundles
Set uncaught java.lang.Throwable
Set deferred uncaught java.lang.Throwable
>
VM Started:
>
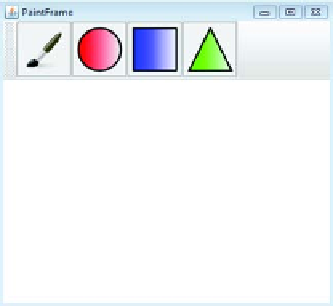
You should see the updated paint window
appear, as shown in figure 8.1. All you had to
do is use the
jdb
command instead of
java
and
specify the class path and main class (the
jdb
command doesn't support the
-jar
option).
You didn't have to tell jdb anything about your
bundles or the
OSG
i framework; from jdb's per-
spective, this is just another Java application.
Figure 8.1
Updated paint
example running under jdb
Felix bundle cache
If you happen to see several I/O exceptions mentioning the felix-cache, check that
you haven't got any leftover debugged Java processes running. When you forcibly
quit jdb using Ctrl-C, it can sometimes leave the debugged process running in the
background, which in this case will stop new sessions from using the local felix-
cache directory.
If you try to draw a shape in the paint window, jdb reports an uncaught exception in
the
AWT
event thread: