Environmental Engineering Reference
In-Depth Information
P
EW
int
Int
D
int
R
s
ES
a
T
a
Topsoi
l
INF
act
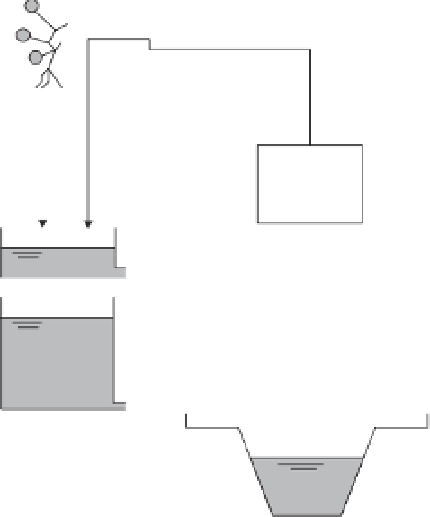
Figure 25.4
Overview of the LISFLOOD model,
reproduced from van der Knijff
et al
. (2010): P
precipitation; Int interception; EWint evaporation of
intercepted water; Dint leaf drainage; ESa evaporation
from soil surface; Ta transpiration (water uptake by
plant roots); INFact infiltration; Rs surface runoff;
D1,2 drainage from top- to subsoil; D2,gw drainage
from subsoil to upper groundwater zone; Dpref,gw
preferential flow to upper groundwater zone; Duz,lz
drainage from upper to lower groundwater zone; Quz
outflow from upper groundwater zone; Ql outflow
from lower groundwater zone; Dloss loss from lower
groundwater zone. Note that snowmelt is not
included in the figure (even though it is simulated by
the model) (Reproduced with permission from van
der Knijff J., Younis, J., and De Roo, A.P.J. (2010)
LISFLOOD: a GIS-based distributed model for river
basin scale water balance and flood simulation.
International Journal of Geographical Information
Science
, 24 (2) 189-212).
D
1,2
Surface
runoff
routing
Subsoil
D
2,gw
D
pref,gw
Q
uz
Upper Zone
D
uz,lz
Lower Zone
Q
lz
D
loss
River channel
water uptake by vegetation, surface runoff, preferential
flow (bypass of soil layer), exchange of soil moisture
between the two soil layers and drainage to the groundwa-
ter, subsurface and groundwater flow, and flow through
river channels. Upward vertical soil moisture and ground-
water flow (capillary rise) are not simulated, and neither
are deep groundwater systems. This imposes some limi-
tations on the use of LISFLOOD in areas that are either
very dry or have a hydrology that is heavily influenced by
deep groundwater, or combinations of both.
the hydrological model used for EFAS. The historical and
real-time observedmeteorological data in use include sta-
tion data from 1990 onwards. These are extracted from
two meteorological databases held at the European Com-
mission Joint Research Centre (JRC), the JRC 'MARS'
database and the 2008 ATKINS EU-FLOOD-GIS report.
Historical data are needed for calibration purposes and
for the calculation of critical thresholds. The real-time
observed meteorological data including data of approx-
imately 1300 meteorological stations across Europe, are
gathered by the EU-FLOOD-GIS data-integration sys-
tem. These real-time data are necessary to calculate the
best initial conditions until the start of the flood simu-
lation, which is driven by deterministic and probabilistic
real-time weather forecasts of the European Centre of
Medium Range Weather Forecast (ECMWF), the Ger-
man Weather Service (Deutscher Wetterdienst; DWD),
and the COSMO consortium (Thielen
et al
., 2009a).
In the next step, three different calculation processes,
(i) critical thresholds, (ii) initial conditions and (iii) flood
forecast, are executed (indicated by the three oval symbols
in Figure 25.5). In order to calculate a flood forecast, first
the initial conditions have to be determined. The compu-
tation of the initial conditions is executed in real time with
the latest observed meteorological data. The gap between
25.3.2 TheEFASHydrological Ensemble
PredictionSystem(HEPS)
The setup of a hydrological ensemble prediction system
is complex and has many individual components that
need to be finely tuned to interact with each other as
shown in Table 25.2. The left-hand side of Figure 25.5
indicates the type of data necessary to run the Euro-
pean Flood Alert System. These include real-time weather
forecasts, real-time observed meteorological data, static
European datasets and historical observed meteorolog-
ical data. The static European datasets are a collection
of thematic layers providing information on topography,
river channel network, land use, soil, etc. These data are
for the basic parameterization of LISFLOOD, which is


Search WWH ::

Custom Search