Environmental Engineering Reference
In-Depth Information
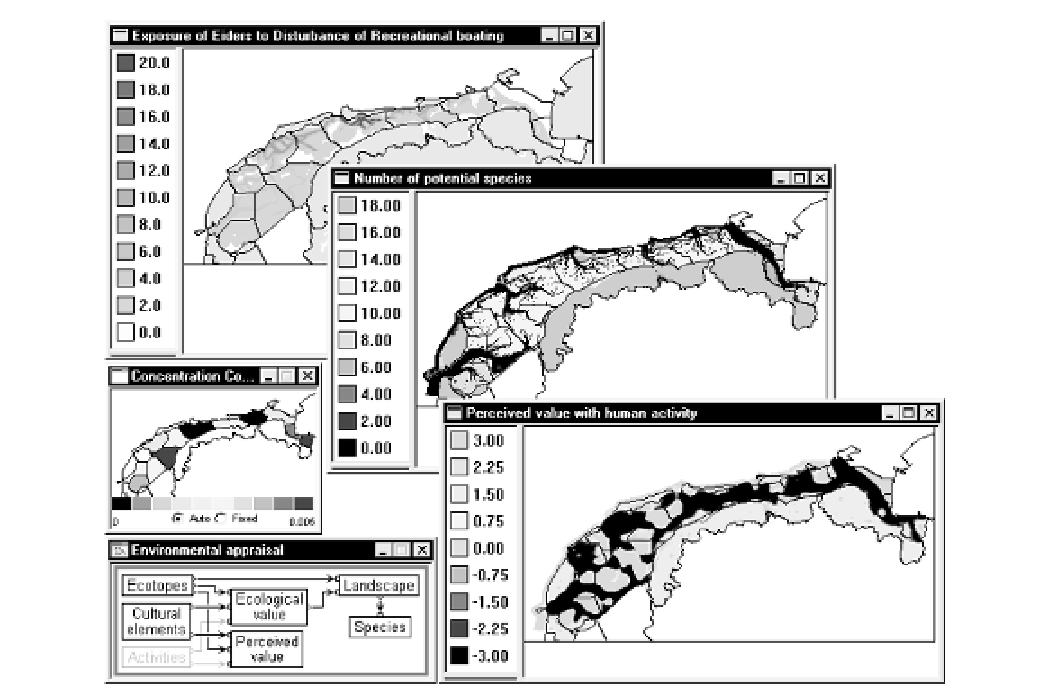
Figure 21.6
Screen dumps fromWadBOS showing a few map and system diagram windows relative to the landscape submodel. The
numbered elements are explained in the text (Courtesy of RIKS).
(copper, TBT, PAK, and oil) will end up in the water
(see Figure 21.3). River-borne pollutants will enter the
sea mainly from Lake IJssel and the River Eems. A simple
hydrodynamic
model calculates how the water moves
from one compartment to the next to eventually flow
into the North Sea. Not only will pollutants move with
the water, but so will other dissolved matter -
Detritus
&Nutrients
- including phosphates, silicon and nitrogen.
In a food chain model derived from the EcoWasp model
(Brinkman, 1993) the
Nutrients
serve as an input to the
Algae
dynamics. Simply stated, the growth of the latter
is determined by the availability of nutrients, the right
climatic conditions, light, or influx from the North Sea
and sweet water systems. The algae in turn are grazed by
filter feeders, including the commercial species
Cockles
& Mussels
. The latter are prey for
Birds
and the
Fishery
.
Every year, policymakers decide on the quantity of cockles
and mussels needed for the survival of the species and
as food for
Birds
. The rest can be fished commercially.
Cockles
are fished and cooked at sea and their shells are
returned into the sea to become a resource for the
Shell
mining
industry. The food-chain dynamics are calculated
on a tidal cycle time step and mostly on the spatial level of
the compartments. Some information, such as the mussel
and cockle biomass and the consumption rates of birds,
is calculated at the cellular level. The latter serves as a
cellular input into the fishing activity.
This description is kept very superficial. The interested
reader can get more ample and more precise descriptions
of the models used in the online documentation of the
WadBOS DSS itself, or in the technical reports (Huizing
et al
., 1998; Engelen 1999; and Uljee
et al
., 2000). From
this description however it should be clear how the dif-
ferent submodels are linked to each other in a network of
mutual, reciprocal influence. It should be clear, too, that
the outputs are visualized by means of a large number of
dynamic maps, each of which is updated at the appro-
priate time step during the simulation. Outputs are also
presented and stored in the form of text, MS Excel tables
and time graphs. Dynamic maps generated during a sim-
ulation can be stored on file for interactive comparison
and further analysis by means of the ANALYSE tool (see
Search WWH ::

Custom Search