Environmental Engineering Reference
In-Depth Information
R
=
0.4 m
R
=
2 m
100
100
50
50
0
0
0
50
100
0
50
100
R
=
50 m
R
=
2500 m
100
100
50
50
0
0
0
50
100
0
50
100
km
km
0.0
0.2
0.4
Elevation [km]
0.6
0.8
1.0
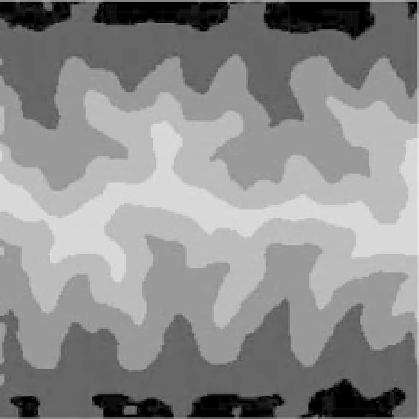
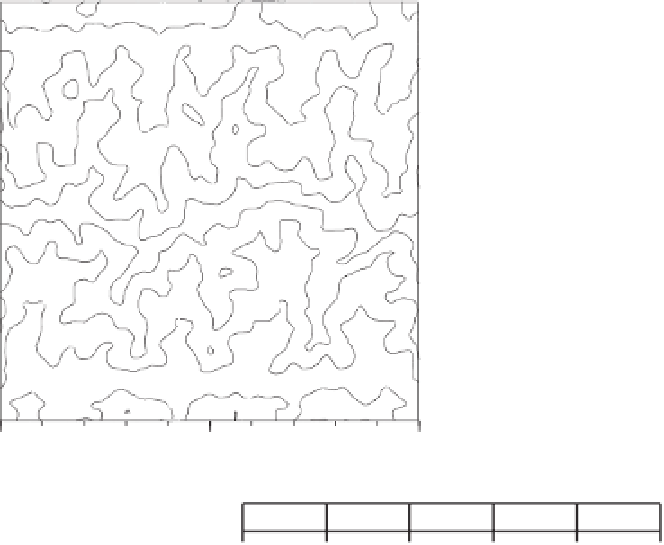
Figure 19.2
Planform view of topography and drainage patterns predicted after 5 My of erosion of an initially flat plateau at an
elevation of 1 km, dropping down to baselevel on two sides. The models include hillslope diffusion and fluvial incision and transport
processes, the latter modelled using the 'undercapacity' model of Beaumont, Fullsack and Hamilton (1992) and Kooi and Beaumont
(1994); cf. Equation 20.11. The plots show the effect of varying the relative efficiency of hillslope diffusion and fluvial incision, as
quantified by the parameter
R
as defined in Equation 20.3 and
K
s
in Equation 20.8. For these models,
K
s
=
10
−
2
my
−
1
;
L
f
=
20 km and
κ
varies between 4
×
10
−
3
and 25 m
2
y
−
1
as indicated by the
R
-value (Adapted with permission
from van der Beek, P.A. and Braun, J. (1998) Numerical modelling of landscape evolution on geological time-scales: A parameter
analysis and comparison with the south-eastern highlands of Australia.
Basin Research
, 10, 49-68).
=
κ/
K
s
; with
κ


Search WWH ::

Custom Search