Environmental Engineering Reference
In-Depth Information
1 km
2
grid cell
(a)
GIS data
Land use
Slope
Soil
Hilslopes from each grid cell
(b)
(c)
WEPP model runs against 30yr climate time series
(d)
MIRSED matrix:
WEPP output
within multi-
dimensional
parameter space
(e)
Runoff adjustment from grid cell AAR
% Adjustment for
scenarios based on upper
uncertainty bounds
% Adjustment for
scenarios based on upper
uncertainty bounds
(f)
Soil erosion (kg mm
−
1
m
−
1
) x runoff (mm)
Averaged response from hillslopes in grid cell
w
i
x
i
w
i
(g)
Σ
Σ
x
w
=
(h)
5% quantile hillslope soil erosion t ha
−
1
yr
−
1
95% quantile hillslope soil erosion t ha
−
1
yr
−
1
50% quantile hillslope soil erosion t ha
−
1
yr
−
1
Validation against observed survey data
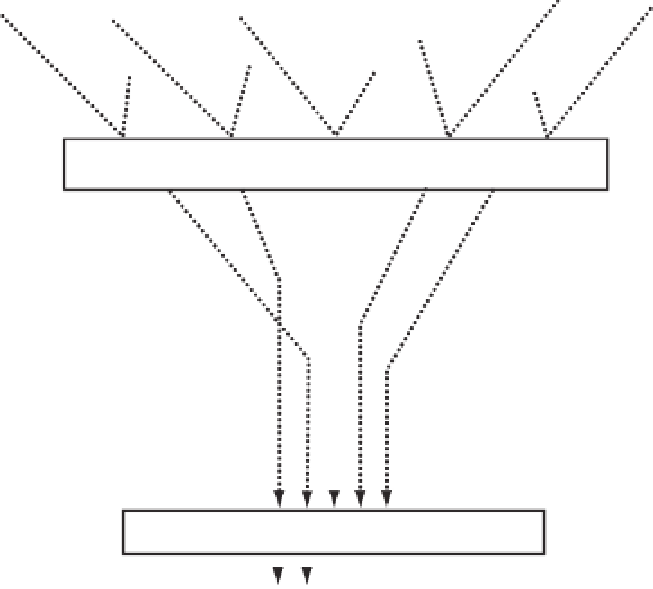
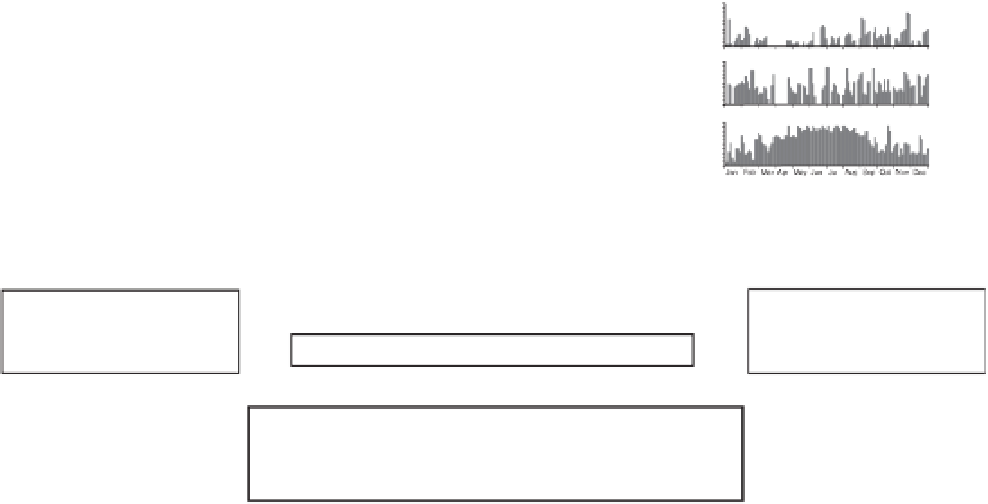
Figure 15.2
Schematic representation of the MIRSED approach to representing WEPP predictions in a simplified framework.


Search WWH ::

Custom Search