Environmental Engineering Reference
In-Depth Information
250
250
200
200
150
150
100
100
50
50
0
0
0
0
125
250
375
500
125
250
375
500
(a)
(b)
250
250
200
200
150
150
100
100
50
50
0
0
0
0
125
250
375
500
125
250
375
500
Mean downstream distance (cells)
(c)
(d)
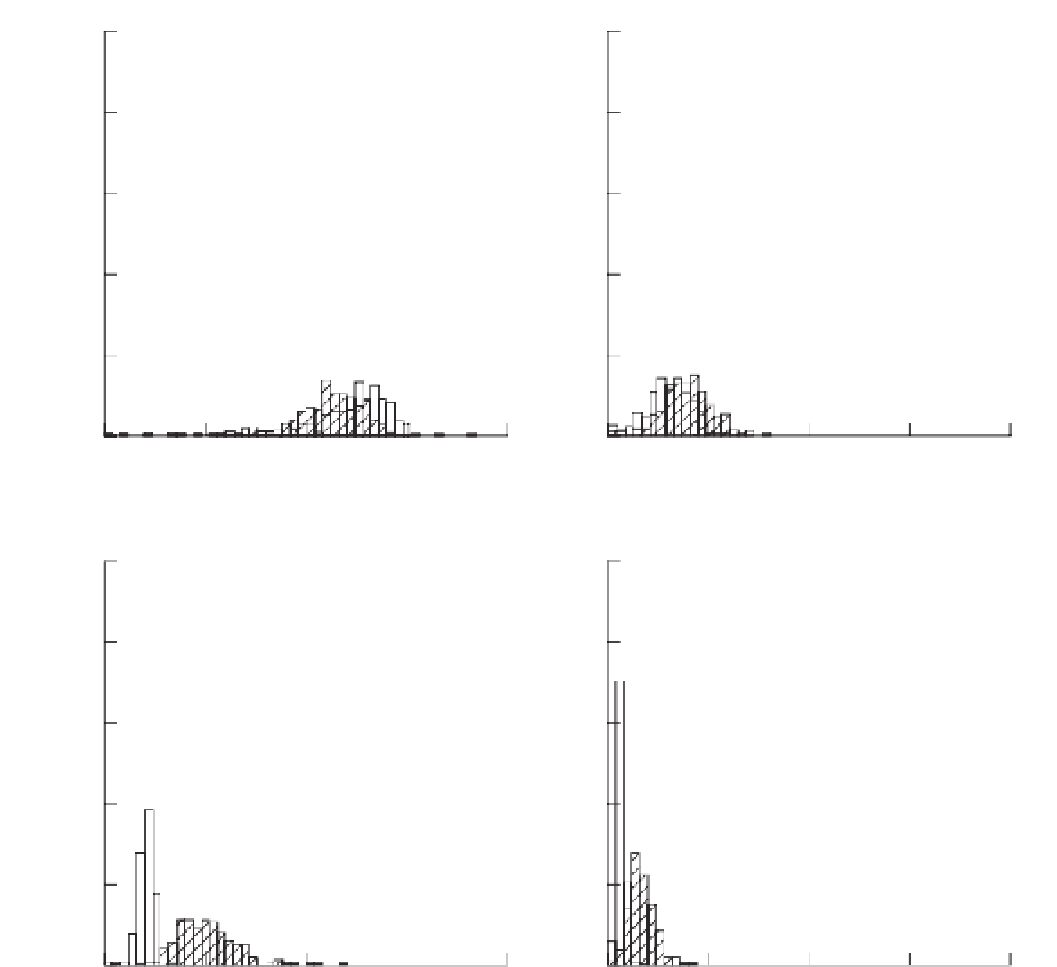
Figure 13.5
Frequency distributions of average downstream distance travelled per landscape, for each landscape type. (a) 5%
obstacles, random settlement; (b) 15% obstacles, random settlement; (c) 5% obstacles, settlement in DWZ only; (d) 15% obstacles.
Mean obstacle sizes are 2
×
2 cells (white columns) and 6
×
6 cells (hatched columns). Source: Bond
et al
. (2000).
(i) reaction-diffusion systems, (ii) metapopulation and
patch-occupancymodels, and (iii) individual-basedmod-
els. Alongside recent methodological developments in
dynamic modelling, there have also been significant
advances in static, data-driven models of animal pop-
ulations. Such static models can be extremely useful
in identifying the important factors to be included in
dynamic models. The many approaches taken to spatial
modelling of animal populations have respective strengths
and weaknesses and there is no single approach to be rec-
ommended over others. Indeed, there is often much to
be gained from applying multiple approaches together.
Search WWH ::

Custom Search