Environmental Engineering Reference
In-Depth Information
It is only recently that any representation of plant
ecology has been incorporated into so called General
Circulation Models (GCMs). Cox
et al
. (2000) coupled
an interactive carbon-cycle model into the Hadley Centre
GCM, and projected that the influence of the carbon cycle
could increase the rate of climate change by almost 50%,
mediated by increasing rates of plant respiration and soil
decomposition, as well as a decline in tree cover in the
Amazon rainforest caused by both drying and warming.
These processes give rise to a net movement of carbon
from the land into the atmosphere, further accelerat-
ing the rate of climate change. Since then, numerous
climate-modelling groups have incorporated representa-
tions of the carbon cycle into climate change models,
which were amalgamated into the 'coupled carbon-cycle
climate model inter-comparison project' by Friedlingstein
et al
. (2006). This study reported two main findings: first,
that there was a consensus between models indicating a
positive feedback between the biosphere and atmosphere,
and secondly that the magnitude of the positive feed-
back, measured as the amount of extra carbon dioxide
in the atmosphere at the end of the twenty-first century,
varied enormously between models, from
+
20 ppm to
+
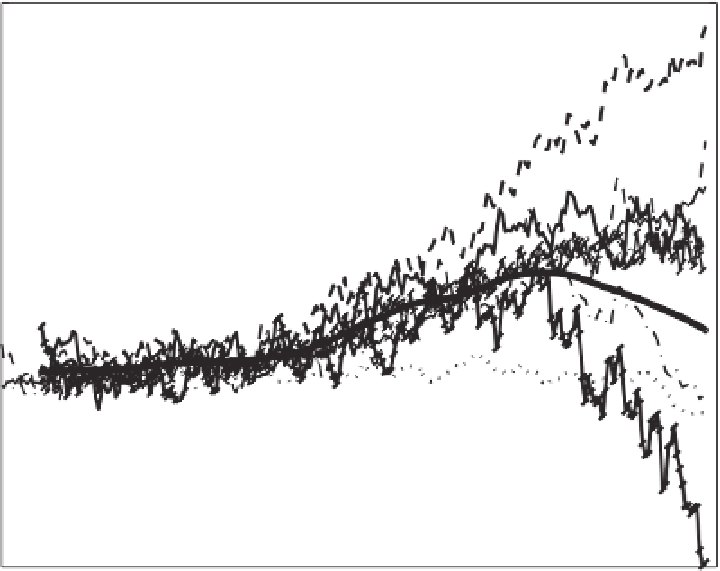
200 ppm (Figure 12.1). However, since then, Thorn-
ton
et al
. (2007) reported that inclusion of the impact
of nitrogen on vegetation generated predictions of faster
soil-nitrogen mineralization under high temperatures and
hence increased plant growth via high N availability. This
result meant that, for the first time, an enduring nega-
tive carbon-cycle climate feedback (ecosystems slowing
the rate of climate change by absorbing emitted CO
2
)
was projected. Overall, the interaction of climate and
the biosphere is currently one of the greatest sources of
uncertainty in climate projections. This uncertainty is not
especially surprising, given the ambitious scope of these
models. The next logical step - to 'screen out' model pre-
dictions which are less well supported by contemporary
data - is under way, but only in its early stages (Hoffman
et al
., 2008).
12
BERN CC
CCSM 1
CLIMBER
FRCGC
MPI
UVic 2.7
LLNL
IPSL CM4 LOOP
UMD
IPSL CM2C
HadCM3LC
10
8
6
4
2
0
−
2
−
4
−
6
1850
1900
1950
2000
2050
2100
Time
Figure 12.1
Net exchange of carbon between the land and the atmosphere for eleven coupled carbon-cycle climate model
simulations (GtC yr-1) reproduced using data from Friedlingstein
et al
. (2006). Names of climate models contributing to the analysis
marked in the legend. Negative values indicate emissions from the land surface associated with drying and warming. Positive values
indicate uptake largely related to carbon dioxide fertilization (Reproduced from Figure 1e and using data from Friedlingstein, P.,
Cox, P., Betts, R.,
et al
. (2006). Climate-carbon cycle Feedback Analysis. Results form the C4MIP Model Intercomparison.
Journal of
Climate
, 19, 3337-53.
American Meteorological Society. Used with permission).


Search WWH ::

Custom Search