Environmental Engineering Reference
In-Depth Information
70 000
60 000
d-8
rho-8
d-infinity
MF
DEMON
kinematic
50 000
40 000
30 000
20 000
10 000
0
Figure 11.4
Differences in the distribution
of micro-catchments within the Tambito
catchment for six different flow-routing
algorithms.
Catchment area (m
2
)
interpolation of the topography because of cloud cover in
the initial orthophotography for the area. The method of
Horn (1981) is also used to calculate aspect (the direction
of the maximum rate of change in elevation).
The catchment of any identified point may be
calculated by following the drainage network upwards
to the watershed. Figure 11.6 shows the catchments
of the outflows of the Tambito DEM. Many of these
catchments are partial because the DEM boundaries are
those of the map sheet rather than the watershed but the
largest catchment (that of the Tambito itself) is complete.
Stream channels are calculated here, as is commonly the
case, by initiating a channel when upslope area is greater
than a threshold upstream area, in this case 1 000 000 m
2
(1 km
2
), although this threshold is, of course, rather
arbitrary (and static) and a value based on cumulative
upstream rainfall may be more useful. The stream-order
map is calculated directly from the flow lines according
the summation of flow line confluences using the
method of Strahler. TOPMODEL wetness is a compound
topographic index commonly used in hydrology to
account for spatial variations in moisture. It is compound
because it combines upslope area,
A
(the propensity
to receive water) with local slope,
s
(the propensity
to shed water) to yield an overall index of wetness as
ln(
A
/tan(
s
)). Further discussion of the use of TOPMODEL
in hydrological analysis can be found in Section 11.2.6.
18million - 21million
11million - 18million
7million - 11million
2million - 7million
−
−
7million -
−
2million
−
7million
−
18million -
−
11million
−
21million -
−
16million
No Data
11million -
−
2million - 2million
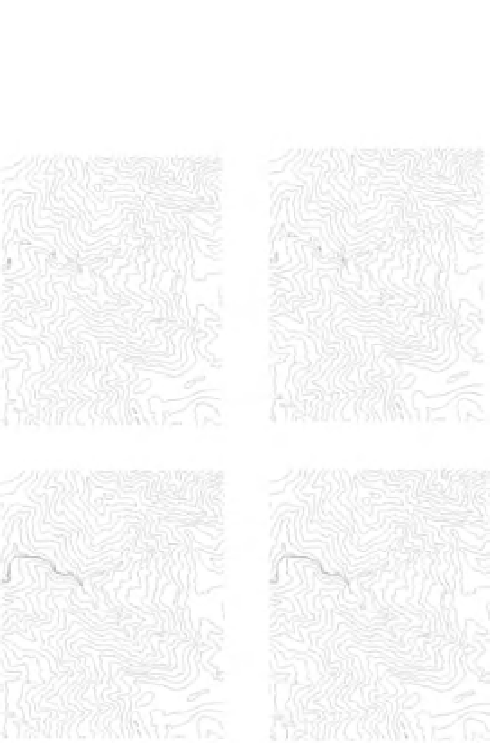
D-8 - MF
D-8 - rho8
D-8 - kinematic
D-8 - DEMON
11.2.3 Thehydrologicallysignificantpropertiesof
catchments
Figure 11.5
Spatial differences in accumulated upslope area
between the D8 and four other algorithms for flow routing.
We have considered some of the complexities of
catchment definition; now let us look a little at the


Search WWH ::

Custom Search