Environmental Engineering Reference
In-Depth Information
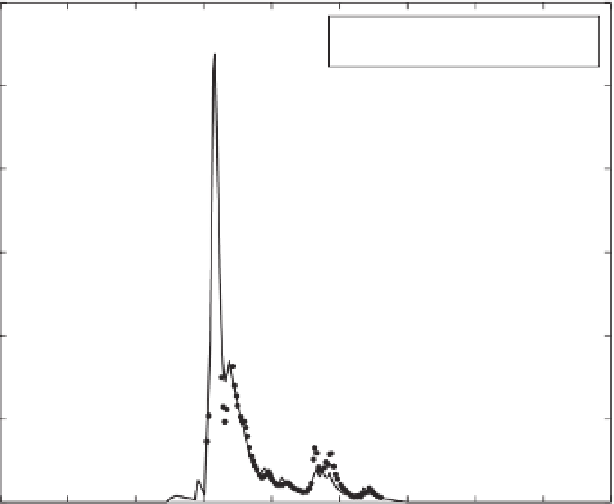
Validation of Model on a Date Set for a Different Year
3
Validation measured flow
DBM modelled flow
2.5
2
1.5
1
0.5
1977.3 1977.4 1977.5 1977.6 1977.7 1977.8
Date
1977.9
1978
1978.1 1978.2
Figure 7.2
Validation of the River Canning DBM model on data not used for identification and estimation.
is almost the same as that obtained in the estimation
analysis.
The DBM model is also consistent with hydrological
theory, as required by the tenets of DBM modelling:
is, by definition, the unit hydrograph, and the TF model
itself can be seen as a parametrically efficient method of
quantifying this unit hydrograph.
3. Finally, the TF model can be decomposed by partial
fraction expansion into a parallel pathway form which
has a clear hydrological interpretation. In particular,
it suggests that the effective rainfall is partitioned into
three pathways, as shown in Figure 7.3: an instantaneous
effect, which, as might be expected, accounts for only
a small fraction (5.9%) of the flow; a fast-flow pathway
with a residence time of 2.574 days, which accounts for
the largest fraction (52.5%) of the flow; and a slow-flow
1. First, the changing soil-water storage conditions in
the catchment reduce the 'effective' level of the rainfall
u
(
t
) and that the relationship between the measured rain-
fall and this effective rainfall (sometimes termed 'rainfall
excess')
u
(
t
) is quite nonlinear. For example, if the catch-
ment is very dry because little rain has fallen for some time,
then most new rainfall will be absorbed by the dry soil
and little, if any, will be effective in promoting increases
in river flow. Subsequently, however, if the soil-water
storage increases because of further rainfall, so the runoff
of excess water from the catchment rises and the flow
increases because of this and inflow from the replenished
groundwater. In this manner, the effect of rainfall on flow
depends upon the antecedent conditions in the catch-
ment and a similar rainfall event occurring at different
times and under different soil-water storage conditions
can yield markedly different changes in river flow.
2. Second, the linear TF part of the model conforms
with the classical 'unit hydrograph' theory of rainfall-flow
dynamics: indeed, its unit impulse response at any time
QUICK
0.537
52.5%
1
+
2.574s
Rain
r
(
t
)
Eff. Rain
Flow
SLOW
u
e
(
t
)
y
(
t
)
41.6%
s
(
t
)
0.82
0.425
1
+
18.66s
+
s
(
t
)
5.9%
INSTANT
0.060
Catchment Storage
Figure 7.3
A diagrammatic representation of the DBM model
decomposition for the River Canning.


Search WWH ::

Custom Search