Information Technology Reference
In-Depth Information
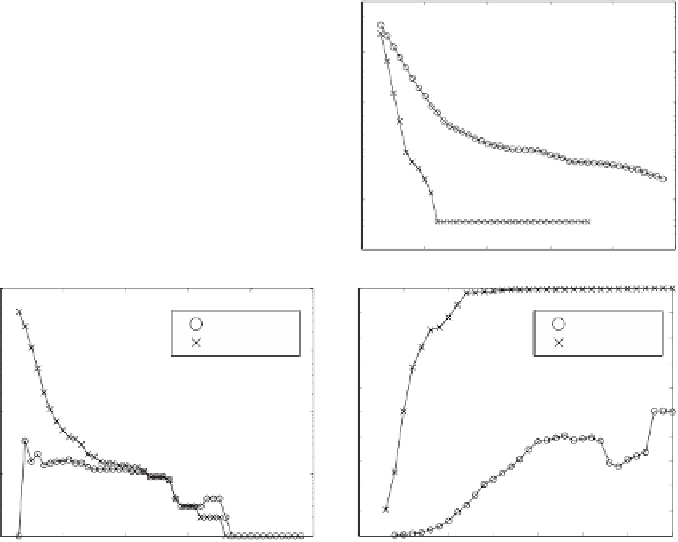
Figure 14.7(a), (b) and (c) respectively shows the total community size
V
X
(
k
)
|}
|
and the number of com-
munities
S
X
(
k
)
for each order
k
for the
k
-core and
k
-dense methods. As shown
in these figures, the results are similar to those of the previous two networks.
Namely, in comparison to the
k
-dense method, the
k
-core method extracts com-
munities with substantially larger sizes. As for the maximum community size
shown in Figure 14.7(b), the
k
-dense method extracts a 36-clique at
k
= 12,
and it is the maximum community up to
k
= 36. The
k
-core method extracts
the maximum community whose size is more than or around one thousand even
when
k
is large (up to around 30).
As shown in Figure 14.7(c), the number of communities extracted by the
two methods are the same when 23
V
X
(
k
)
|
, the maximum community size max
{|
31. In fact, in this range of
k
,the
communities extracted by the
k
-core and the
k
-dense methods are more or less
equivalent and they consist of a clique with a few additional nodes. An example
of such cliques is a complete graph that consists of nodes starting from “List of
authors by name A” to “List of authors by name Z”.
≤
k
≤
10
6
10
6
k−core
k−dense
k−core
k−dense
(a)
(b)
10
5
10
5
10
4
10
4
10
3
10
3
10
2
10
2
10
1
10
1
0
10
20
30
40
50
0
10
20
30
40
50
core order k
core order k
10
4
1
0.9
k−core
k−dense
k−core
k−dense
(c)
(d)
0.8
10
3
0.7
0.6
10
2
0.5
0.4
0.3
10
1
0.2
0.1
10
0
0
0
10
20
30
40
50
0
5
10
15
20
25
30
35
core order k
core order k
Fig. 14.7.
Total size of communities (a), size of the maximum community (b), total
number of communities (c), and normalized entropy (d) of the Wikipedia reference
network