Information Technology Reference
In-Depth Information
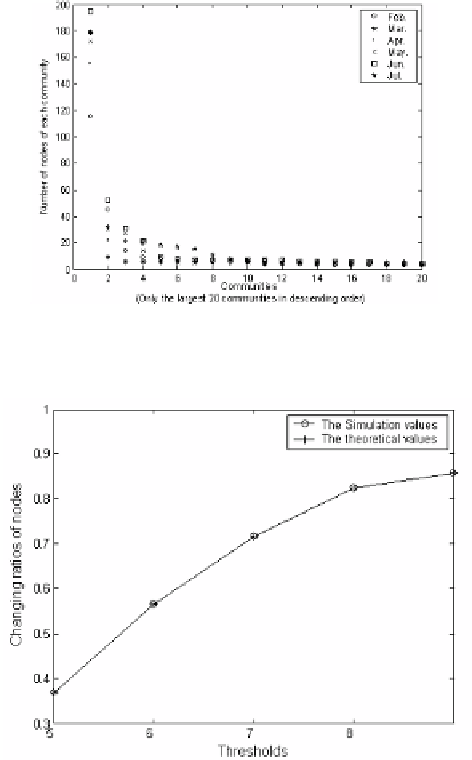
Fig. 13.3.
The numbers of communities of the BBS poster networks from Feb. to Jul.
Fig. 13.4.
The comparisons of the simulation values to the theoretical values of node
numbers with different thresholds
0.0006, the node number is 421, the ratio of 155 to 421 is 0.368, which is denoted
by the first point (drawn by “+”). This value is the theoretical value when the
thresholds are changing. The first point drawn by “o” denotes the actual ratio
of the number of nodes with the former threshold to the number of nodes with
the latter threshold. Clearly, these two curves have any difference, which implies
that the nodes with the former threshold must be contained in the set of nodes
with the latter threshold when these thresholds are in ascending order.
Now we give the relationships between selection methods of the threshold and
some nodes' degrees. Our main attention focuses on the change of the largest ten
nodes with different threshold selections, which as shown in Figure 13.5. With
the first subfigure as an example, when the basis threshold is 0.0005, the ten