Java Reference
In-Depth Information
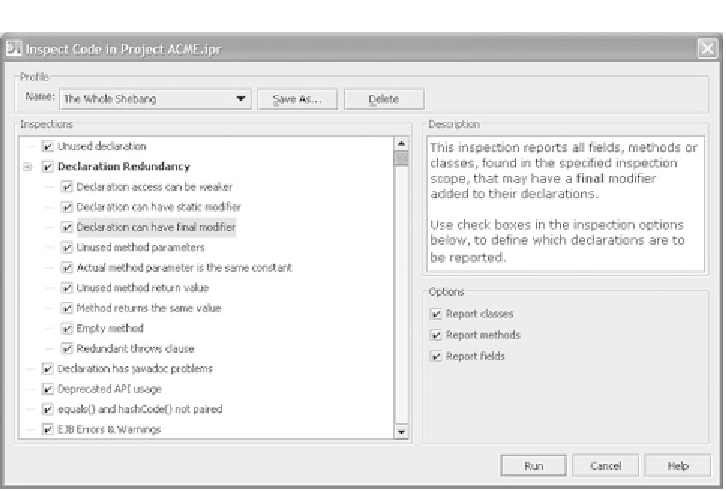
Figure 9.7 IDEA's inspector is aware of a host of conditions it considers questionable. From this
screen, you can specify which inspections to run.
nice. The results are stored in an
XML
file that you can view with
IDEA
by select-
ing
Analyze | View Offline Inspection Results
.
To start the inspector from the command line, you use either the inspec-
tion.exe (on Windows) or inspection shell script (on
UNIX
and Mac), located
under the
IDEA_HOME\bin
directory. The script takes the following arguments:
Project file path
is the path to the .
IPR
file of the project you want to
inspect.
■
Inspection profile
path
is the path to the inspection profile to use. Inspec-
tion profiles are saved under the inspection directory of your
IDEA
settings.
■
Output path
specifies the file where you want to store the results (the result
is an
XML
file).
■
Tw o
Options
are available: The
-d
<directory>
option lets you limit the
inspection to a certain directory rather than the entire project. The
-v
<verbosity
level>
option lets you control the amount of output generated
(0 for quiet, 1 for normal, and 2 for extra noisy).
■