Java Reference
In-Depth Information
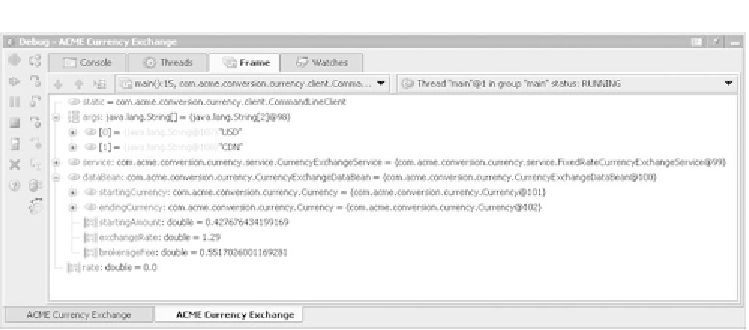
Figure 6.3
The Debug window gives you insight into what's happening inside your application.
The Debug window
We'll cover the details of each area of the
Debug
window as we go along, but we
want to introduce its basic layout. The tabs across the top perform the follow-
ing functions:
Console
displays program input and output, courtesy of standard input
and output streams. This tab isn't available if you're debugging an applica-
tion remotely.
■
Threads
lets you view and navigate into all of your application's threads.
■
Frame
gives a view of the currently selected stack frame.
■
Wa tc h e s
shows a list of expressions you're watching, evaluated under the
currently selected stack frame.
■
Along the left is the debugger's toolbar, full of icons primarily used to step
through the program. These actions are also available through the
Run
menu, if
you prefer. We'll cover the meaning of these in a bit. You'll probably spend most
of your time in the
Frame
tab, examining runtime values. We'll discuss how that
works, and how to interpret the results, in section 6.4.
Suspending program execution
Once you launch your program in the debugger,
IDEA
hands over control of its
execution to you. The execution options available in the debugger are summa-
rized in table 6.2. Before you can begin stepping through your running applica-
tion, the program must be suspended. There are two ways to suspend program

