Environmental Engineering Reference
In-Depth Information
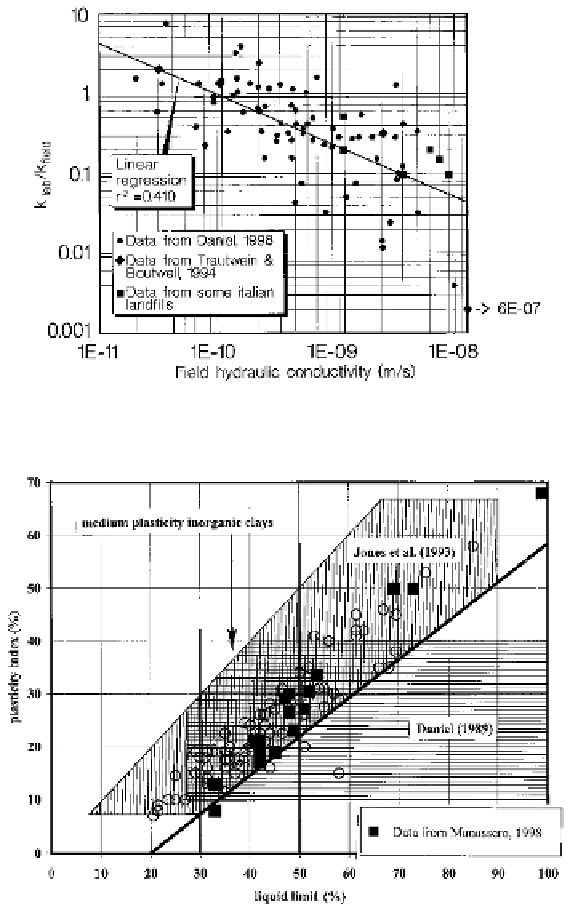
Figure 16.11.
Ratio of laboratory (k
lab
) to field (k
field
) [MAN 00]
Figure 16.12.
Index properties of some compacted clays [MAN 00]
Figure 16.13 shows the variation of the field hydraulic conductivity
versus
the
percentage of water content-dry density (
w
− γ
d
) points laying above the line
connecting the peaks of compactions curves developed using a range of compacting
energy. It is possible to observe a rather strong correlation between these two