Environmental Engineering Reference
In-Depth Information
The parameters for the soil are as follows: Young's modulus 1 x 10
7
Pa, Poisson
ratio 0.2, porosity 0.5, bulk modulus 6 x 10
13
Pa and density 1,800 kg/m
3
. Specific
heat for soil is 1.25 x 10
5
J/Kg°C and the thermal expansion coefficient 1 x 10
4
°C
-1
.
Absolute permeability is 0.22 x 10
-14
m
2
for the infiltration case and 0.57 x 10
-14
m
2
for evaporation. Bulk modulus for water is 8 x 10
14
Pa, its viscosity 1 x 10
-3
Ns/m
2
,
density 1,000 kg/m
3
and zero specific heat. The thermal expansion coefficient for
water is zero and dispersivity is 1 x 10
-8
m
2
/s. State equations for perfect gas have
been assumed for the air phase, viscosity 1 x 10
-5
Ns/m
2
, zero specific heat, density
1.22 kg/m
3
and dispersivity 1 x 10
-8
m
2
/s. Heat conductivity of the mixture is
1.15 W/m°K.
Initial conditions for solutes in the water and air phase are zero everywhere and
boundary conditions are unit constant water and air concentrations at the top of the
column in the case of both infiltration and evaporation. The computational time step
is initially one hour and then is increased by one order after each 10 steps until
1,000 hours are reached.
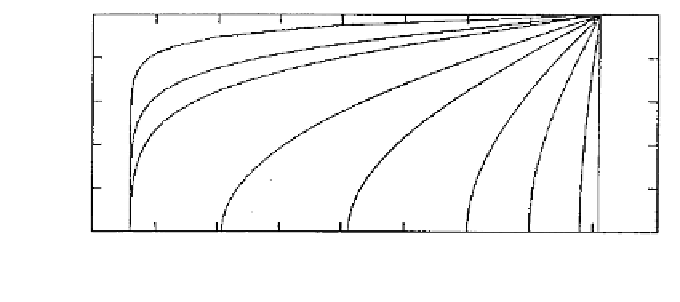
The temperature distribution in the soil column due to an increase in surface
temperature of 15°K (from 283.2 to 298.2°K), is shown in Figure 14.13. The figure
illustrates how the imposed thermal gradient at the surface slowly proceeds toward
the bottom of the sample and eventually a new equilibrium state is attained.
Figure 14.14 shows the air pressure distribution for the case of volume increase
(swelling) due to infiltration. For comparison we have drawn the solution for the
case of a rigid soil. In this last case the pressure build-up is stronger. As in the first
example, it is clear that soil deformation should generally be included in the
simulation. The swelling process due to infiltration is depicted in Figure 14.15.
0.1
1.11hr
0.08
0.06
8.89hr
0.04
71.1hr
0.02
142.2hr
284hr
569hr
0
282
284
286
288
290
292
294
298
296
300
Temperature (Degrees K)
Figure 14.13.
Temperature distribution in the soil column