Environmental Engineering Reference
In-Depth Information
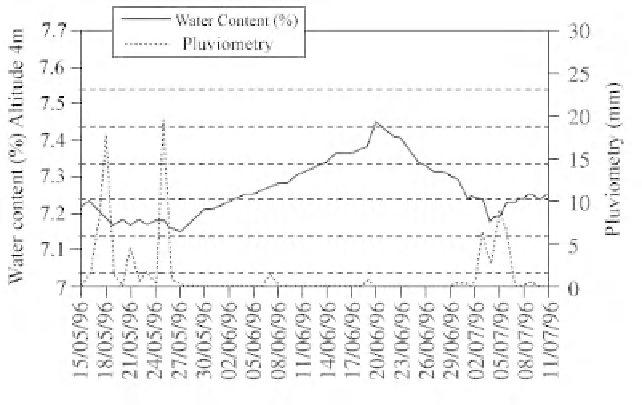
Figure 11.8.
Influence of pluviometry
from May to July 1996
Figures 11.7 and 11.8 illustrate the water content profiles observed inside the
wall at 4 m height and the pluviometry corresponding to south-westerly winds of
speeds over 10 m/s. Important rainfalls observed at the end of May 1996 induced an
increase in water content measured inside the wall at 4 m height. Water content
fluctuates from 7.2% to 7.4% in 21 days. After the rainy period, in the month of
June there is no rainfall. Thus, the wall dried during this period, water was able to
evaporate from June 20 to July 4, and water content decreased linearly with time
until it reached the initial value of 7.2%.
This linear drying phase shows a constant drying flow due to direct evaporation
of water from the façade. This corresponds to the capillary transfer of water through
the stone towards the surface at a constant rate. A second and slower evaporation
phase was expected, due to water vapor diffusion through the stone towards the wall
surface, but was not observed as new rainfalls disturbed that process.
These particularly strong rain events linked to specific wind directions do not
have a long term influence. The weather events do not modify the general aspect of
the water content profile measured by inside-wall readings.