Environmental Engineering Reference
In-Depth Information
large maximum. In this case, moisture is distributed in an approximately
homogenous way, from 10 to 60 mm.
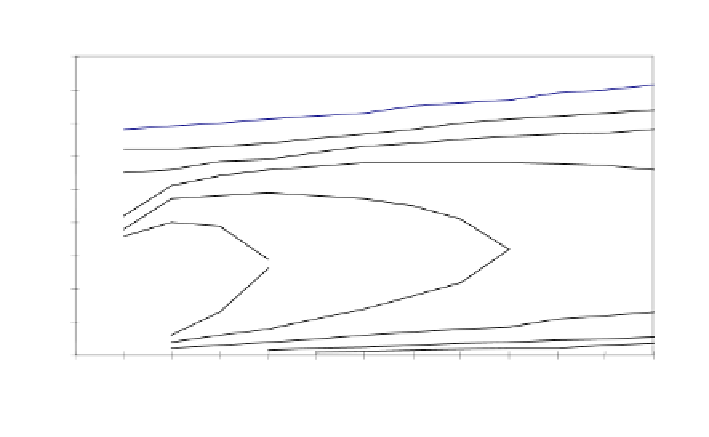
The observation of iso-moisture content lines during drying allows us to
understand how this moisture maximum occurs. The convexity of these lines is
turned towards the time axis. The case of Sander sandstone is illustrated in Figure
8.6; the critical moisture content of this stone equals 70 kg/m
3
. As long as the
moisture content is higher than this value, water is transferred to the surface in a
liquid state. Below this value, water is transported in a gaseous state.
Wetting
Drying
90
30
80
4
0
50
Kg/m3
70
depth
(mm)
60
60
50
40
70 Kg/m3
80 Kg/m3
30
20
10
0
0
2
4
6
8
10
12
14
16
18
20
22
24
Time (hours)
Figure 8.6.
Iso-moisture content lines of Sander sandstone during drying (expressed in kg/m
3
)
during the third moistening-drying cycle. 1 cycle = 2h rain + 22h drying,
same boundary conditions as in Figure 8.5 [SNE 96]
During drying, most of the strain develops at the interface between the zone with
the highest moisture content and adjacent dryer zones. The steeper the profile of
moisture content against depth, the higher the risk of failure in the zone where the
moisture gradient develops. This is how scaling may occur on a stone. If the
interface develops at some millimeters inside the stone, flaking will develop. If the
interface is deeper, very thick scales (several centimeters in some cases) will
develop. Contour scaling, which is a type of scaling where a system of cracks
develops at a regular depth under the surface, whatever the shape of the surface, is
also explained in this way. Scaling will generally develop at a higher rate if water
contains soluble salts.