Environmental Engineering Reference
In-Depth Information
Soluble salts also have an influence on the hydric behavior of building materials.
This aspect is developed later in this chapter.
8.2.3.
Water: water vapor transfer properties
The physics of water transport in stone is described elsewhere in this topic. We
will hereafter simply explain how the distribution of water, during moistening and
drying phases, influences the formation of specific degradation patterns.
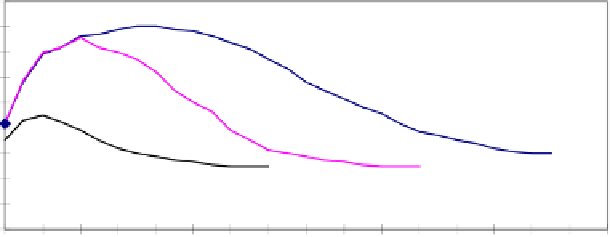
Kunzel and Krüss [KUN 95] have proposed and experimentally verified a
numerical model allowing us to foresee the moisture distribution in a stone as a
function of the water uptake coefficient and water vapor permeability. The moisture
distribution curves they obtained show, in most cases, the maximum moisture
content inside the stone. Figure 8.5, reproduced from [SNE 96], shows as an
example of the calculations made for three stones having very different values of
water content under a vacuum
q
sat
and at atmospheric pressure
q
atm
.
90
80
70
60
50
40
30
20
10
0
0
10
20
30
40
50
60
70
80
90
100 110 120 130 140 150 160
Depth (mm)
grès de Burg
grès de Sander
grès calcareux
Burg Sandstone
calcareous Sandstone
Sander Sandstone
Figure 8.5.
Calculated moisture distribution curves of Burg, Sander and calcareous
sandstone after three moistening/drying cycles. Burg sandstone: coarse grained and porous
(q
sat
: 150 kg/m
3
,
q
atm
: 25 kg/m
3
); Sander sandstone: microporous (q
sat
: 130 kg/m
3
, q
atm
: 25
kg/m
3
); calcareous limestone: low porosity (q
sat
: 70 Kg/m
3,
q
atm
: 25 kg/m
3
). Boundary
conditions for the calculations: T° = 20°C, Relative humidity = 25%, 1 cycle = 2h rain + 22h
drying, thickness of finite element = 1 mm [SNE 96]
The moisture maximum is closer to the surface in denser stones, having a slower
water transfer. Coarse and porous stones, such as Burg sandstone, show a flat and