Environmental Engineering Reference
In-Depth Information
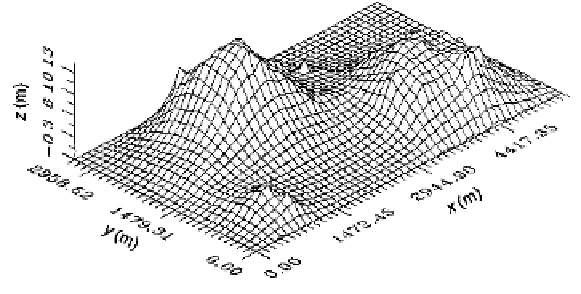
Figure 5.20.
Spatial distribution of the excess of pore pressure after two years of pumping
5.1.5.3.
The subsidence of Abano Terme: results
The total period of analysis is nine years from 1985. Figure 5.19 presents the
spatial distribution of compaction after six months of pumping, whereas Figure 5.20
shows the distribution of excess pore pressure after two years. In Figure 5.21 the
compaction increment is shown between the second and third year of exploitation.
The maximum value is about 4 cm, whereas between the eighth and the ninth year
(see Figure 5.22) this increment is reduced to 1 cm. This evolution compares
reasonably well with the recorded one (see Figure 5.17).
Figure 5.21
.
Spatial distribution of the compaction increment
between the first and second year