Database Reference
In-Depth Information
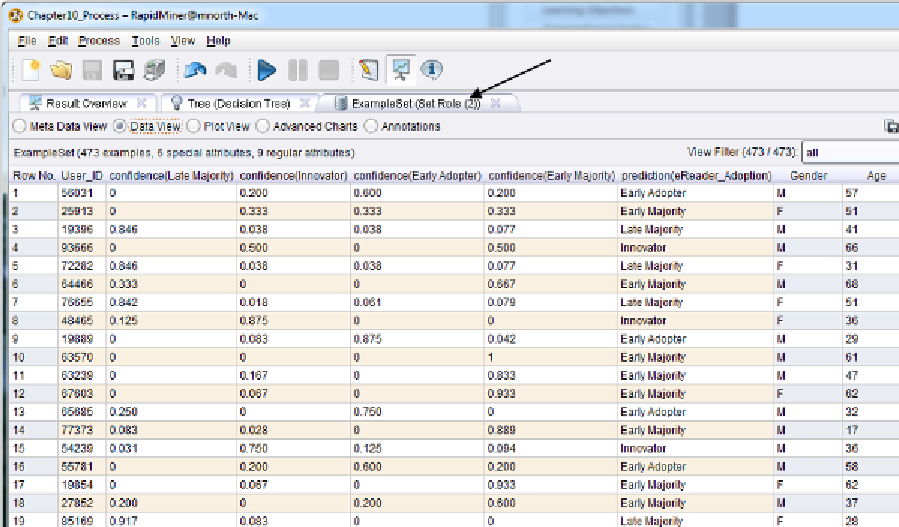
Switch to the ExampleSet tab in Data View. We see here (Figure 10-13) that changing our tree's
underlying algorithm has, in some cases, also changed our confidence in the prediction.
Figure 10-13. New predictions and confidence percentages using Gini.
Let's take the person on Row 1 (ID 56031) as an example. In Figure 10-10, this person was
calculated as having at least some percentage chance of landing in any one of the four adopter
categories. Under the Gain Ratio algorithm, we were 41% sure he'd be an early adopter, but
almost 32% sure he might also turn out to be an innovator. In other words, we feel confident he'll
buy the eReader early on, but we're not sure how early. Maybe that matters to Richard, maybe not.
He'll have to decide during the deployment phase. But perhaps using Gini, we can help him
decide. In Figure 10-13, this same man is now shown to have a 60% chance of being an early
adopter and only a 20% chance of being an innovator. The odds of him becoming part of the late
majority crowd under the Gini model have dropped to zero. We know he will adopt (or at least we
are
predicting
with 100% confidence that he will adopt), and that he will adopt early. While he may
not be at the top of Richard's list when deployment rolls around, he'll probably be higher than he
otherwise would have been under gain_ratio. Note that while Gini has changed some of our
predictions, it hasn't affected all of them. Re-check person ID 77373 briefly. There is no
difference in this person's predictions under either algorithm—RapidMiner is quite certain in its
predictions for this young man. Sometimes the level of confidence in a prediction through a