Database Reference
In-Depth Information
3)
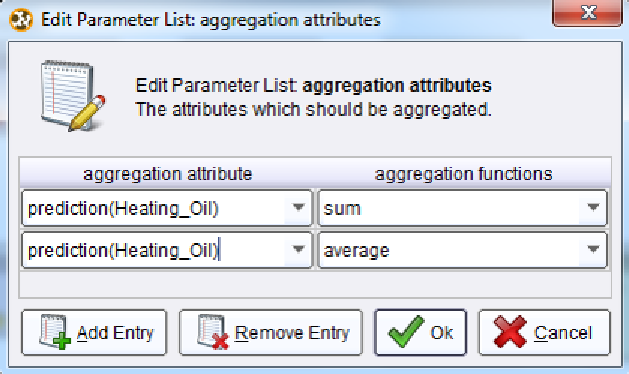
Click on the Edit List button. A window similar to Figure 8-10 will appear. Set the
prediction(Heating_Oil) attribute as the aggregation attribute, and the aggregation function
to 'sum'. If you would like you can add other aggretations. In the Figure 8-10 example, we
have added an average for prediction(Heating_Oil) as well.
Figure 8-10. Configuring aggregations in RapidMiner.
4)
When you are satisfied with your aggregations, click OK to return to your main process
window, then run the model. In results perspective, select the ExampleSet(Aggregate) tab,
then select the Data View radio button. The sum and average for the prediction attribute
will be shown, as depicted in Figure 8-11.
Figure 8-11. Aggregate descriptive statistics for our predicted attribute.
From this image, we can see that Sarah's company is likely to sell some 8,368,088 units of heating
oil to these new customers. The company can expect that on average, their new customers will
order about 200 units each. These figures are for all 42,042 clients together, but Sarah is probably
going to be more interested in regional trends. In order to deploy this model to help her more
specifically address her new customers' needs, she should probably extract the predictions, match