Database Reference
In-Depth Information
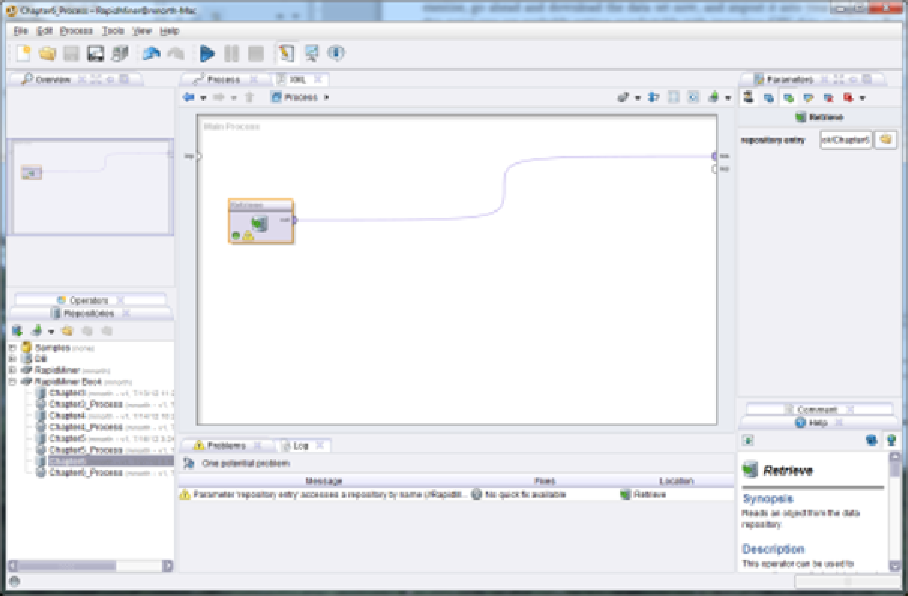
Figure 6-1. Cholesterol, Weight and Gender data set added to a new process.
Go ahead and click the play button to run your model and examine the data set. In Figure 6-2 we
can see that we have 547 observations across our three previously defined attributes. We can see
the averages for each of the three attributes, along with their accompanying standard deviations
and ranges. None of these values appear to be inconsistent (remember the earlier comments about
using standard deviations to find statistical outliers). We have no missing values to handle, so our
data appear to be very clean and ready to be mined.
Figure 6-2. A view of our data set's meta data.


