Agriculture Reference
In-Depth Information
50
12
Shrub-land
45
A
B
Gmelina forest
10
40
Gmelina forest
35
8
30
Shrub-land
Homegardens
Homegardens
6
25
Gmelina forest
Homegardens
Shrub-land
20
4
Gmelina forest
Homegardens
Shrub-land
15
10
2
5
0
0
0
10
20
30
40
50
60
70
0
100
200
300
400
500
Individuals
Individuals
500
70
Gmelina forest
450
Gmelina forest
C
D
60
400
Homegardens
350
50
300
Gmelina forest
Homegardens
Shrub-land
40
Shrub-land
250
30
200
Gmelina forest
Homegardens
Shrub-land
20
150
Shrub-land
100
Homegardens
10
50
0
0
0
10
20
30
40
50
0
10
20
30
40
50
Point counts
Point counts
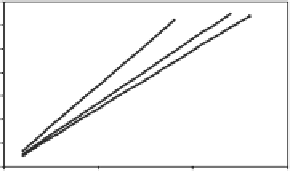
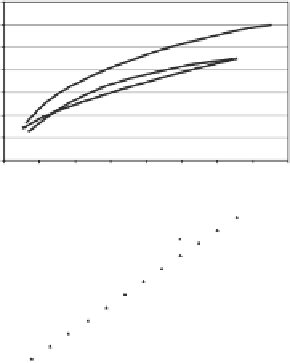
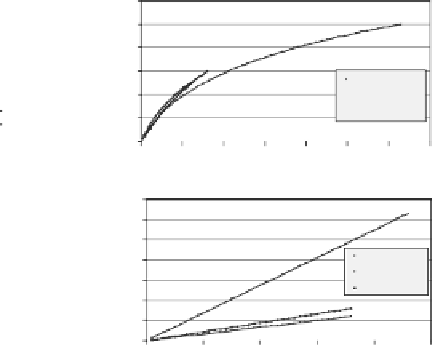
Fig. 16.2
Smoothed bird species accumulation curves rescaled to the number of individuals for
all resident species (A) and for forest species (B) and smoothed bird population density graphs for
all resident species (C) and forest birds (D)
14
7
Homegardens
Shrub-land
A
12
B
6
Gmelina forest
10
5
Homegardens
Shrub-land
Gmelina forest
8
4
6
3
2
4
1
2
0
0
0
20
40
60
80
100
120
140
160
0
20
40
60
80
100
120
140
individuals
individuals
160
140
Homegardens
Shrub-land
Shrub-land
140
C
D
120
Homegardens
Gmelina forest
120
Gmelina forest
100
100
80
80
60
60
40
40
20
20
0
0
0
5
10
15
0
5
10
15
Mistnet lines
Mistnet lines
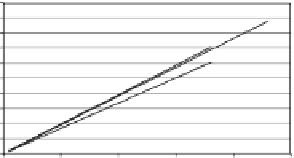
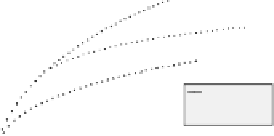
Fig. 16.3
Smoothed bat species accumulation curves rescaled to the number of individuals for all
bats (A) and for fruit bats (B) and smoothed bat population density graphs for all bats (C) and fruit
bats (D)
lowed by shrub-land and Gmelina forest (Fig. 16.3C). This pattern was similar for
the subset of fruit bats, with higher fruit bat densities in homegardens compared to
the other two habitat types (Fig. 16.3D).


Search WWH ::

Custom Search