Environmental Engineering Reference
In-Depth Information
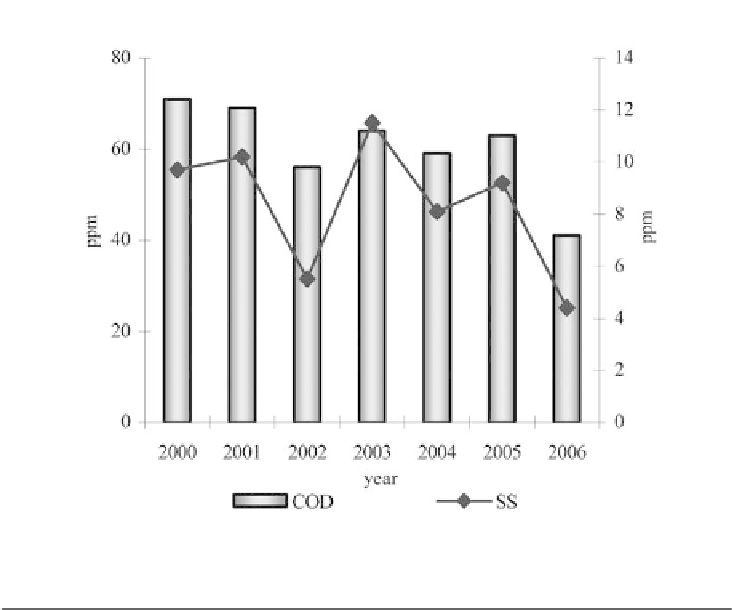
Figure 3.
COD and SS of the effluent [44].
Table 3.
The performance of CO
2
-reducing projects [44].
Contribution
(1,000 ton-CO
2
/ year)
Project
Waste heat recovery Project
1,300
Total energy saving from
1997 to 2006
2010 energy-saving Project
160
Total energy saving in 2006
Eco-industrial park* 210 Ton-CO
2
/KLOE
Water-quenched slag replacing the use of Concrete 2,170 CO
2
reduction: 0. 79 per
Ton of steel
* Eco-industrial park means CSC sold energy which it did not need and gases such as N
2
, O
2
, coal breeze and steam
to increase income and reduce pollution.
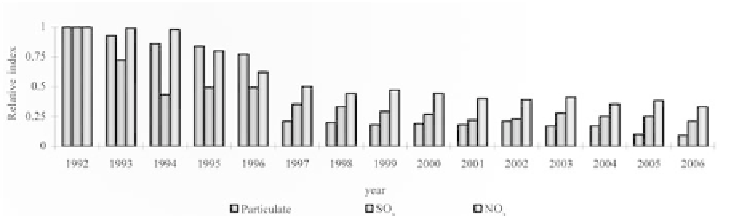
Figure 4.
Air pollution per ton of steel production (relative index) [44].


Search WWH ::

Custom Search