Environmental Engineering Reference
In-Depth Information
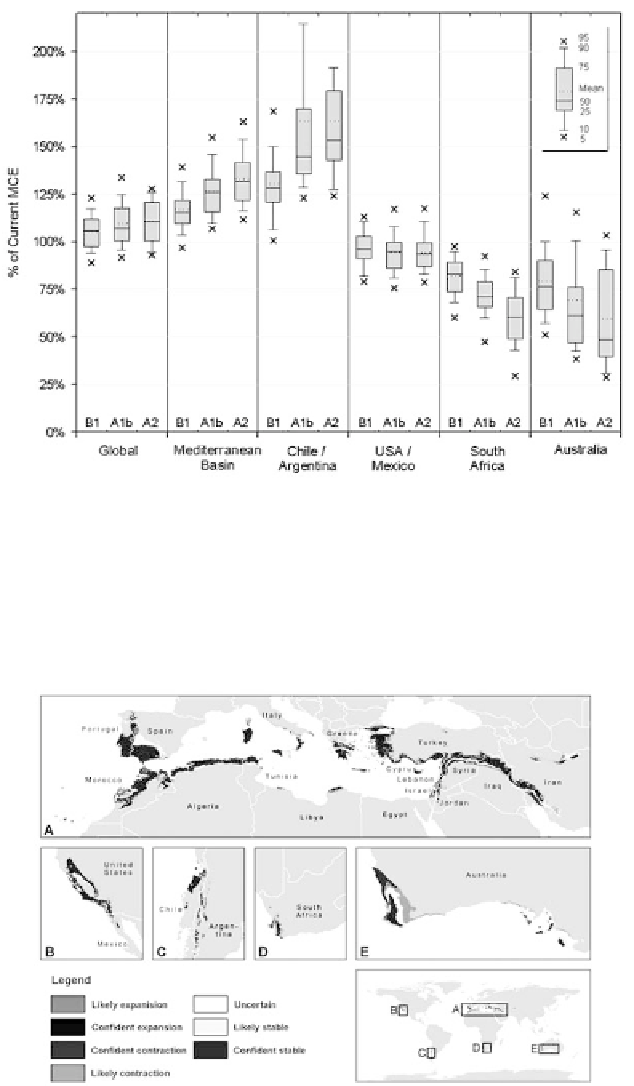
Figure 1.
Relative size of the projected future (2070-2099) to the current (1960-1989) MCE. The
results are presented in box and whisker diagrams representing the percentiles of the AOGCM
simulations for the B1 (low), A1b (medium) and A2 (high) emissions scenarios. The solid line within
each box represents the median value, and the dotted line the mean value. The top and bottom of
the boxes shows the 75th and 25th percentiles, the top and bottom of each whisker shows the 90th
and 10th percentiles, and the small X's show the 95th and 5th percentiles. The left-most portion of
the figure represents the results for all five regions, and the region specific results are presented to the
right. The 95th percentile values for Chile/Argentina for the moderate and high emissions scenarios
(320% and 235%) are not included to show more detail in the remaining regions.
Figure 2.
Projected status of the MCE in 2070-2099 relative to 1960-1989 under high (A2) emissions
scenario.
The projected status is considered likely if at least 66% of the AOGCM simulations agree,
confident if at least 90% agree. Maps A. through E. are un-projected at 1:50,000,000 scale.


Search WWH ::

Custom Search