Environmental Engineering Reference
In-Depth Information
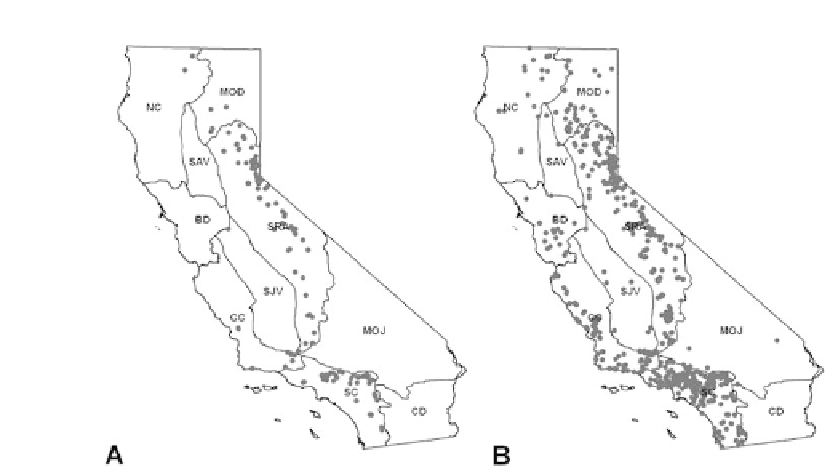
Figure 2.
Rodent samples. Study area and geocoded data for (a) 995 positive rodent samples (166
unique locations) and (b) 3,788 negative rodent samples (905 unique locations). Lines designate
California bioregions (NC = Klamath/North Coast; BD = Bay Area/Delta; CC = Central Coast; SC =
South Coast; MOD = Modoc Plateau; SRA = Sierra; SAV = Sacramento Valley; SJV = San Joaquin
Valley; MOJ = Mojave Desert; CD = Colorado Desert).
Coyote Point Data
Sampling for plague in coyotes (
Canis latrans
) was conducted independently from
sampling for plague in rodents. Unlike the rodent data, coyote blood specimens were
collected opportunistically as part of a depredation control and state-wide plague sur-
veillance partnership between the California Department of Health and the US De-
partment of Agriculture/Wildlife Services. Because coyotes can occupy a home range
of up to 80 km
2
[37], the location of capture may not be the location of infection;
however, the opportunistic sampling program provides a more complete description of
general plague activity throughout the state, albeit at a coarser spatial resolution. Coyote
sera were tested by passive hemagglutination to F1 antigen of
Y.
pestis
; specimens
with antibody titer ≥1:32 were considered positive [33-35]. The plague surveillance
partnership program and the diagnostic tests that were used are described in detail by
[7].
In order to compare environmental niche model results based on rodent/ground
squirrel data to data on positive and negative samples of California coyotes, records
for 477 positive and 2,250 negative coyotes were identifi ed from the database
(Figure 3). Collection sites for coyote samples were geocoded using National Geo-
graphic TOPO software (National Geographic Society 2001) based on fi eld records
that indicated distance and direction from a town [7, 33, 38]. Collection sites that
could not be reliably located were excluded from this analysis. All geocoded points
were projected to Teale Albers, NAD 1983 projection. The geocoded locations of the
coyote case points were distributed in the northern and southern Sierra Nevada, along
the Pacifi c coast, and across the Modoc plateau.


Search WWH ::

Custom Search