Environmental Engineering Reference
In-Depth Information
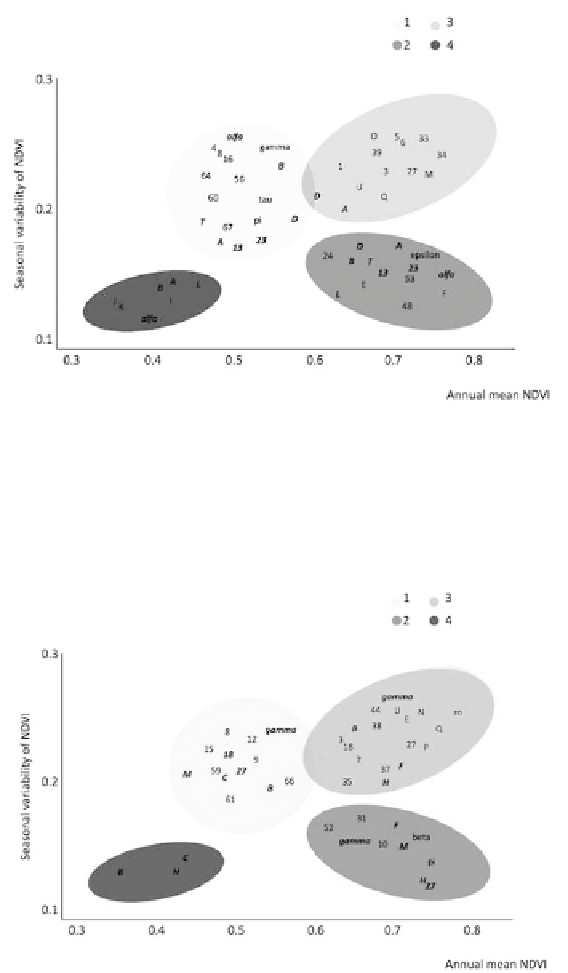
Figure 2.
Associations between
A. marginale
MSP1a R1 repeat sequences and ecoregion clusters,
plotted along the values of the first two axes derived from Principal Components Analysis on NDVI
time series. Figure plots the 80% confidence ellipses of the annual mean NDVI and the seasonal
variation of NDVI for each ecoregion cluster, as well as the plot of the isolates in the NDVI envelope.
Each letter displays the mean position of the records for that strain. Unique sequences for each
ecoregion are displayed in plain type. Sequences recorded in more than one ecoregion cluster are
displayed in italic bold.
Figure 3.
Associations between
A. marginale
MSP1a RL repeat sequences and ecoregion clusters,
plotted along the values of the first two axes derived from Principal Components Analysis on NDVI
time series. Figure plots the 80% confidence ellipses of the annual mean NDVI and the seasonal
variation of NDVI, for each ecoregion cluster, as well as the plot of the isolates in the NDVI
envelope. Each letter displays the mean position of the records for that strain. Unique sequences for
each ecoregion are displayed in plain type. Sequences recorded in more than one ecoregion cluster
are displayed in italic bold.


Search WWH ::

Custom Search