Biology Reference
In-Depth Information
(A)
Overall
(B)
EGFR
-Mutation-Positive
Hazard ratio, 0.74 (95% CI, 0.65-0.85)
P<0.001
Events: gefitinib, 453 (74.4%); carboplatin
plus paclitaxel, 497 (81.7%)
Hazard ratio, 0.48 (95% CI, 0.36-0.64)
P<0.001
Events: gefitinib, 97 (73.5%); carboplatin
plus paclitaxel, 111 (86.0%)
1.0
1.0
0.8
0.8
0.6
0.6
0.4
0.4
Carboplatin
plus
paclitaxel
Carboplatin
plus
paclitaxel
Gefitinib
0.2
0.2
Gefitinib
0.0
0.0
0
4
8 12
Months since Randomization
16
20
24
0
4
8
12
16
20
24
Months since Randomization
No. at Risk
No. at Risk
Gefitinib
609
363
212
76
24
5
0
Gefitinib
132
108
71
31
11
3
0
Carboplatin plus
paclitaxel
608
412
118
22
3
1
0
Carboplatin plus
paclitaxel
129
103
37
7
2
1
0
(D)
Unknown
EGFR
Mutation Status
Hazard ratio, 0.68 (95% CI, 0.58-0.81)
P<0.001
Events: gefitinib, 268 (69.4%); carboplatin
plus paclitaxel, 316 (80.2%)
(C)
EGFR
-Mutation-Negative
Hazard ratio, 2.85 (95% CI, 2.05-3.98)
P<0.001
Events: gefitinib, 88 (96.7%); carboplatin
plus paclitaxel, 70 (82.4%)
1.0
1.0
0.8
0.8
0.6
0.6
0.4
0.4
Gefitinib
Carboplatin
plus
paclitaxel
Carboplatin plus
paclitaxel
0.2
0.2
Gefitinib
0.0
0.0
0
4
8 12
Months since Randomization
16
20
24
0
4
8
12
16
20
24
Months since Randomization
No. at Risk
No. at Risk
Gefitinib
91
21
4
2
1
0
0
Gefitinib
386
234
137
43
12
2
0
Carboplatin plus
paclitaxel
85
58
14
1
0
0
0
Carboplatin plus
paclitaxel
394
251
67
14
1
0
0
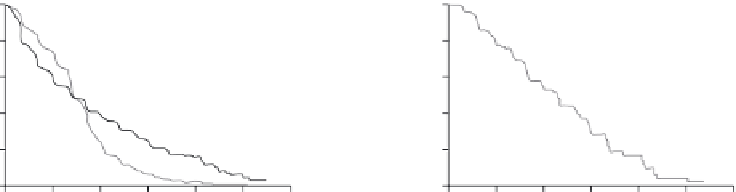
FIGURE 1.5
Kaplan-Meier curves for progression-free survival are shown for the overall population
(A), patients who were positive for the
EGFR
mutation (B), patients who were negative for the
EGFR
mutation (C),
and patients with unknown
EGFR
mutation status (D). Analyses were performed on the basis of the intention-to-
treat population. With respect to the overall population, results of the supportive secondary analyses (including
a log-rank test, which is valid under the null hypothesis even when hazards are not proportional, and analysis in
the per-protocol population) were consistent with the result of the primary analysis. Hazard ratios were calculated
with the use of a Cox proportional-hazards model, with the WHO performance status (0 or 1, or 2), smoking his-
tory (nonsmoker or former light smoker), and sex as covariates. EGFR denotes epidermal growth factor receptor.
explosion of surveys of many different tumor types to identify driver mutations and subsets
of tumors, and these studies are expected to result in new targeted therapies in the coming
years. While the targeted therapies described above demonstrate remarkable response rates
in the right patients, eventually patients relapse because their tumors develop resistance. In
addition to identifying potentially driver mutations in tumors, NGS has begun to illuminate
the cause of such tumor resistance. In a
tour de force
genomic analysis of different regions of
a renal cell carcinoma within a single patient, Swanton and colleagues demonstrated sig-
nificant intra-tumor heterogeneity with regard to mutations
[35]
. Thus, therapeutics like cri-
zotinib or gefitinib that are targeted to a single mutation could select clones with resistant


Search WWH ::

Custom Search