Java Reference
In-Depth Information
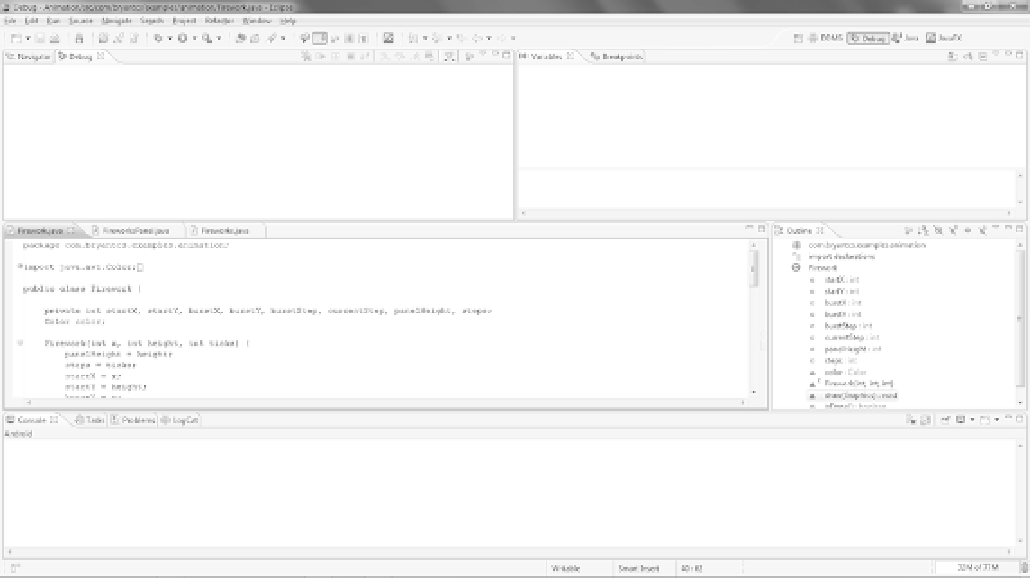
Figure 11-2. Eclipse Debug perspective
Let's look at this screen in more detail. You can see the code in the middle left panel of the
application. The middle right panel displays an outline of the class. So far, it's the same as the Java
perspective, but with a lot less space. The top left area shows the Debug panel and a tab to switch back to
the Navigator panel. When you run the debugger, the Debug panel shows the call stack (all the objects
the program went through to get to its current point). The top right area shows the breakpoints and
variables. We'll talk about breakpoints and variables shortly. Finally, the bottom panel shows a number
of possible views. You generally want the console view when debugging.
Don't worry if your debugger doesn't look exactly like mine. Like every software developer, I've
customized my environment a bit, and we may be on different versions. The general layout is still the
same, though, and that's enough to show you the relevant parts.
Breakpoints and Variables
A breakpoint is a place in the code where you want to stop the execution of a program. Computers run
programs one instruction at a time. As a result, you can interrupt the flow of instructions and make the
computer wait while you look at the values that are produced by your code at a particular spot.
Fortunately, computers don't get bored, so you can make them wait as long as you like.
When you debug an application, you create temporary breakpoints, which appear in the
Breakpoints view, wherever you want the debugger to stop. The debugger lets your application run until
it reaches one of those points in the code; it then suspends your program, and shows you the values of
the various objects and primitives in the Variables view.
Eclipse lets you set a number of different kinds of breakpoints: